


The falling wedge pattern, also known as the descending wedge, is one of the most effective bullish chart formations in technical analysis. It is widely used by forex and gold traders to identify potential breakout opportunities, bullish reversals, and trend continuation setups.
Its strength lies in the fact that it often appears before strong upside momentum, making it highly valuable for traders seeking favorable risk-to-reward opportunities.
This guide explains what the falling wedge is, how to identify it correctly, and how to trade both continuation and reversal scenarios with professional precision.
What Is a Falling Wedge Pattern?
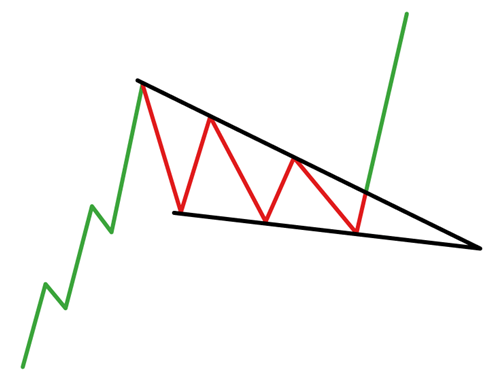
The falling wedge pattern is a bullish chart formation created when price moves between two downward-sloping converging trendlines.
These trendlines connect:
- lower highs
- lower lows
Both lines slope downward, but the upper resistance line falls faster than the lower support line, causing the wedge to narrow over time.
This tightening structure signals that bearish momentum is weakening, even though price is still declining.
Eventually, price breaks above the upper resistance line, often leading to a strong bullish move.
From a technical perspective, the falling wedge can signal either:
- bullish continuation
- bullish reversal
The interpretation depends entirely on the preceding trend.
Rising Wedge vs Falling Wedge
The rising wedge is the opposite formation.
While the falling wedge is generally bullish, the rising wedge is typically bearish and appears in downtrending markets or near reversal zones.
Understanding the distinction between these two patterns is essential for accurate trade execution.
Misidentification is one of the most common errors among less experienced traders.
How to Identify a Falling Wedge Pattern
The falling wedge can function as either a continuation or reversal pattern, which often creates confusion.
The key factor is the direction of the trend before the wedge forms.
Continuation Pattern
If the falling wedge appears during an existing uptrend, it is considered a bullish continuation pattern.
This means the market is pausing temporarily before resuming higher.
Reversal Pattern
If the falling wedge forms during a downtrend, it becomes a bullish reversal pattern.
This suggests that bearish momentum is weakening and a new uptrend may be forming.
The identification process should follow these steps:
- Identify whether the market is in an uptrend or downtrend
- Connect the lower highs and lower lows
- Confirm that both trendlines slope downward and converge
- Look for divergence with oscillators such as RSI or stochastic
- Wait for a confirmed breakout above resistance
This confirmation process significantly improves trade reliability.
How to Trade the Falling Wedge Pattern
There are two primary ways to trade this formation.
1) Falling Wedge Continuation Pattern
In this setup, the wedge appears within an existing uptrend.
Price temporarily consolidates and pulls back in a controlled downward channel.
This pullback creates the wedge.
Once price breaks above resistance, the broader bullish trend is expected to resume.
For example, in a gold chart, price may break above the descending wedge resistance, only to briefly fall back again.
This is commonly known as a fake breakout or fakeout.
This behavior is normal in financial markets.
It also highlights the importance of proper stop loss placement.
A stop that is too tight may result in premature exit before the actual breakout occurs.
For better trade protection, traders may place the stop loss:
- below the lowest low داخل the wedge
- below the wedge structure itself
Allowing sufficient space gives the trade room to develop naturally.
Once the breakout is confirmed, price often resumes the long-term bullish trend.
Measuring Technique to Set Target Levels
The falling wedge includes a practical built-in target projection method.
To estimate the take profit level:
- Measure the vertical height of the wedge at its widest point
- Project that same distance upward from the breakout point
The projected level becomes the potential target zone.
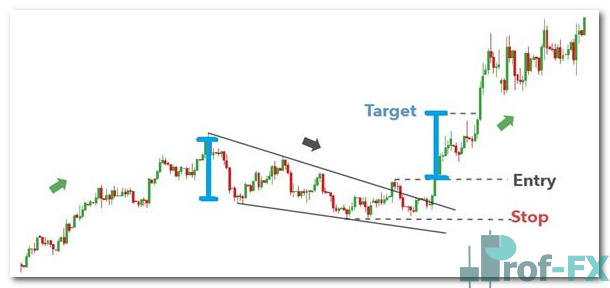
This method provides an objective profit target rather than relying on assumptions.
Professional traders often combine this with previous resistance levels for added confirmation.
2) Falling Wedge Reversal Pattern
The reversal setup occurs when the falling wedge forms after an extended downtrend.
This is one of the strongest bullish reversal signals in technical analysis.
For example, in a USD/CHF chart, price may continue making lower lows before gradually entering sideways consolidation.
At this stage, the lower highs and lower lows begin compressing into a wedge.
Once price breaks and closes above the resistance trendline, the reversal signal is confirmed.
This breakout suggests that sellers are losing control and buyers are entering with conviction.
A standard professional setup includes:
- entry: above resistance breakout
- stop loss: below recent swing low
- take profit: projected using wedge measurement technique
- or prior resistance level
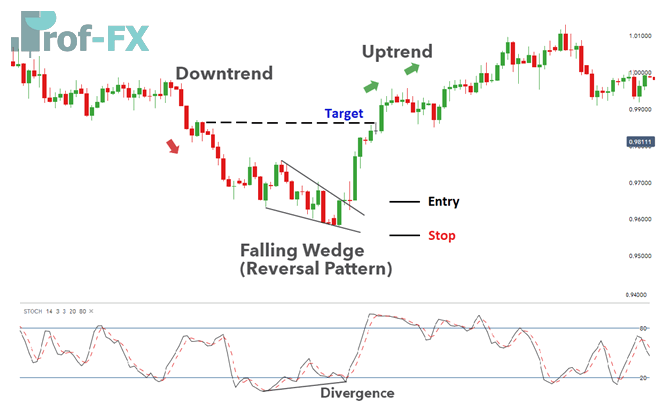
Always maintain a positive risk-to-reward ratio when defining targets.
Confirmation Signals for Better Accuracy
The falling wedge becomes significantly stronger when confirmed by additional indicators.
Volume Confirmation
A breakout supported by increasing volume suggests stronger conviction behind the bullish move.
Higher volume often improves the validity of the breakout.
Divergence Confirmation
Oscillator divergence is another strong signal.
For example:
- price forms lower lows
- stochastic or RSI forms higher lows
This bullish divergence suggests that downside momentum is fading.
Such divergence frequently precedes major reversals.
This confirmation is especially powerful in reversal scenarios.
Key Points to Remember
Several principles are essential when trading the falling wedge:
- Correct trend identification is critical
- Both continuation and reversal setups are bullish
- The pattern often precedes strong directional moves
- It usually offers clear entry, stop loss, and target levels
- Risk-to-reward ratios are often highly favorable
The most important professional conclusion is this:
the context of the trend determines how the wedge should be traded.
Without trend context, the pattern can be misinterpreted.
Advantages and Limitations of the Falling Wedge
Advantages
- Appears frequently across financial markets
- Useful in forex, gold, stocks, and indices
- Allows traders to join a trend after missing the initial move
- Provides clear entry, stop, and take profit levels
- Offers strong risk-to-reward opportunities
Limitations
- Can be difficult for novice traders to identify correctly
- Often confused with other wedge or channel patterns
- Requires confirmation from oscillators and volume
- Can represent either reversal or continuation
- False breakouts are possible
This is why confirmation and disciplined risk management remain essential.
Professional Trading Insight
The falling wedge is highly effective because it visually captures declining bearish momentum inside a compressed structure.
When combined with:
- trend analysis
- RSI / stochastic divergence
- volume confirmation
- support and resistance
- proper stop loss discipline
it becomes one of the most powerful bullish chart patterns in technical trading.
For experienced traders, it is particularly valuable in markets preparing for explosive breakout moves.
Further Reading on Forex Trading Patterns
To strengthen your pattern recognition skills, it is highly recommended to also study other major formations such as:
- head and shoulders
- double top
- double bottom
- triangles
- flags and pennants
Mastering these patterns will significantly improve your technical decision-making framework.
Prof FX continues to provide authoritative forex news and technical analysis on the trends influencing the global currency markets.


