


Very few chart patterns illustrate a clear shift in market direction as effectively as the double bottom pattern. This formation typically appears at the end of a downtrend and signals a potential bullish reversal, offering traders structured opportunities to identify long entries with defined risk.
For beginner traders, the double bottom is especially valuable because it visually communicates seller exhaustion, growing buyer interest, and a transition in market control.
Key Topics Covered in This Guide
In this article, we will explore:
- What a double bottom pattern is
- How to correctly identify a double bottom on price charts
- Practical ways to trade the double bottom pattern
- How this pattern applies across forex, stocks, and major financial markets
What Is a Double Bottom Pattern?
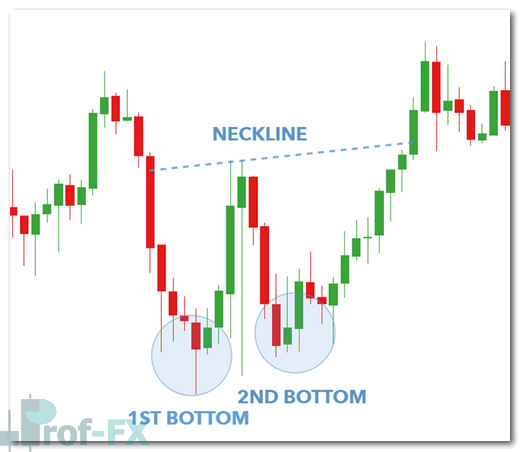
A double bottom pattern consists of two distinct swing lows forming near the same horizontal price level. Between these two lows, price stages a moderate rebound, signaling that buying interest is emerging at the lows.
Visually, the pattern resembles the letter “W” and typically forms after a sustained or moderate downtrend. The key characteristics include:
- A first low followed by a corrective rally
- A second low that fails to break meaningfully below the first
- A resistance level (known as the neckline) formed at the high between the two bottoms
The bullish confirmation occurs when price breaks and closes above the neckline, signaling that buyers have gained control and a trend reversal may be underway.
Double Bottom Chart Pattern Illustration
Understanding the Psychology Behind the Double Bottom
From a market psychology perspective, the double bottom reflects selling pressure losing momentum. Sellers attempt to push price lower a second time but fail to establish a new low. This inability signals weakening bearish conviction, while buyers begin stepping in more aggressively.
Once the neckline is broken, it confirms that demand has overtaken supply—often resulting in an acceleration higher as stop-loss orders from short sellers are triggered.
Double Bottom vs. Double Top Pattern
The double top pattern is the bearish counterpart to the double bottom. While the double bottom forms at market lows and signals bullish reversals, the double top forms at market highs and signals potential bearish reversals.
Key differences:
- Double bottom confirmation occurs at a resistance break
- Double top confirmation occurs at a support break
Both patterns are widely used across forex, equities, indices, and commodities, making them core tools in classical technical analysis.
How to Identify a Double Bottom Pattern on Charts
To accurately identify a valid double bottom pattern, traders should follow a structured approach:
Step-by-Step Identification Guide
First, locate two clearly defined bottoms that form at approximately the same price level. These lows should be visually distinct and not part of minor market noise.
Next, assess the time separation between the two bottoms. The distance should be meaningful relative to the chosen timeframe—patterns forming too quickly tend to be unreliable.
Then, identify the neckline resistance, which is the swing high between the two lows. This level is critical, as it provides the confirmation trigger.
Finally, look for technical confluence, such as:
- Moving averages
- Momentum oscillators (RSI, Stochastic)
- Support and resistance zones
Traders should also remain cautious when attempting to trade double bottoms against strong prevailing downtrends.
Trading the Double Bottom Pattern in Forex and Stocks
The double bottom pattern is commonly used across both forex and equity markets, with the same underlying principles applying regardless of the instrument.
NZD/USD Double Bottom Example
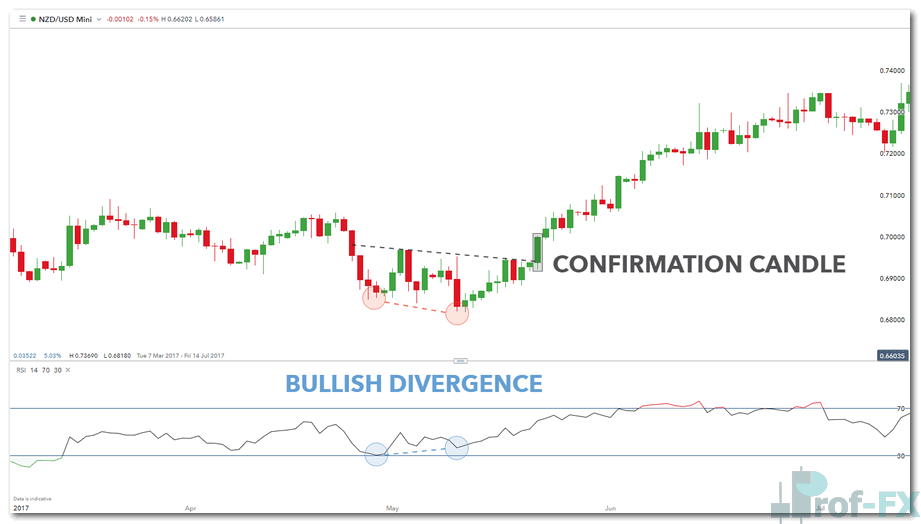
In this NZD/USD example, a double bottom forms following a mild downtrend. The setup gains additional strength when combined with the Relative Strength Index (RSI), which displays bullish divergence—a classic momentum-based confirmation.
Risk management in this setup is straightforward:
- Stop-loss: Placed below the lowest point of the two bottoms
- Targeting: Traders may apply a 1:2 risk-to-reward ratio or use nearby resistance levels identified through price action
More conservative traders may wait for a confirmation candle close above the neckline, sacrificing some reward potential in exchange for higher probability.
Double Bottom Pattern on Stocks: Apple Inc Example

The Apple Inc example demonstrates that the double bottom pattern behaves consistently across asset classes. Once price closes decisively above the neckline, the breakout signals strong bullish intent.
The highlighted candle in this chart clearly closes above resistance after multiple failed attempts, confirming buyer dominance and validating a long entry.
As with forex, traders should ensure:
- Trend context supports the trade
- Momentum indicators align with the bullish bias
- Position sizing and risk limits are properly defined
Risk Management When Trading Double Bottoms
Even when a textbook double bottom appears, trading against a strong bearish trend requires caution. Supporting technical factors must align, and risk management remains non-negotiable.
Best practices include:
- Avoiding oversized positions
- Using predefined stop-loss levels
- Maintaining consistent risk-to-reward ratios
Patterns improve probabilities—but they never eliminate risk.
Expanding Your Knowledge of Technical Chart Patterns
If you want to deepen your understanding of price action and reversal signals, consider exploring related technical patterns:
- Bullish and Bearish Engulfing Patterns for candlestick-based reversals
- Support and Resistance Analysis to validate chart formations
- Top 10 Candlestick Patterns every trader should recognize
Combining chart patterns with indicators and market structure analysis helps traders develop higher-probability trade setups.
Prof FX delivers ongoing forex news, macroeconomic insights, and professional-grade technical analysis focused on the forces shaping global currency markets.


