Trading with the Harami Candle: Key Insights
The Harami candlestick pattern is widely used in forex trading to identify potential trend reversals as well as trend continuations. Its consistent appearance across charts and clear structure make it a reliable tool for technical traders.
From a professional trading perspective, the Harami pattern is highly respected due to its ability to signal market turning points while allowing for controlled risk exposure. When applied correctly, it becomes a valuable component in any price action trading strategy.
This guide will cover:
- The definition and structure of the Harami candlestick
- Practical uses in forex trading
- Proven strategies for trading Harami patterns effectively
What Is a Harami Candlestick?
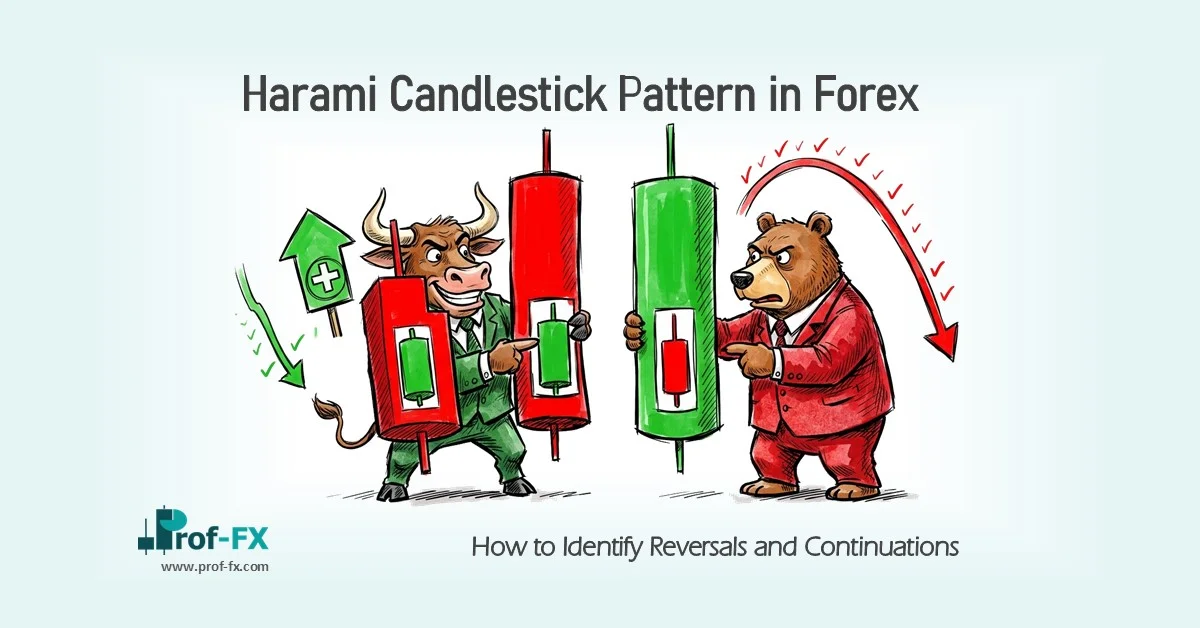
The Harami is a two-candle Japanese candlestick pattern that indicates either a potential reversal or continuation in the market.
The term “Harami” translates to “pregnant” in Japanese, which accurately reflects the structure of the pattern:
- A large initial candle (the “mother” candle)
- Followed by a smaller candle (the “baby”) that forms within the range of the first
This pattern can appear in both bullish and bearish variations.
Types of Harami Candlestick Patterns
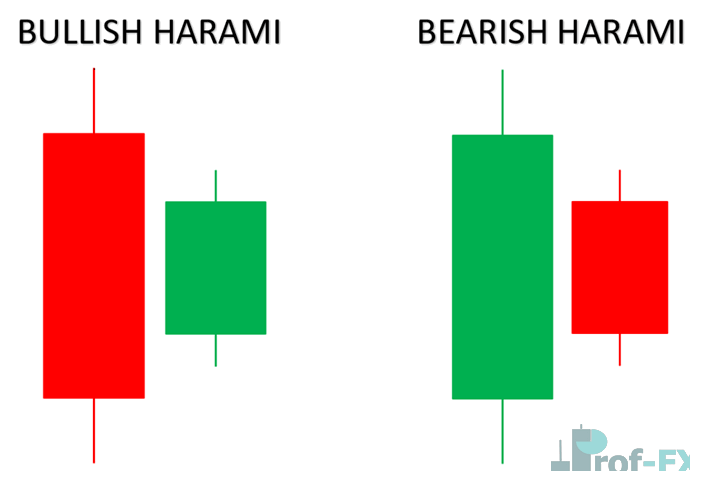
Bullish Harami
- Forms during a downtrend
- First candle: Large bearish (red) candle
- Second candle: Smaller bullish (green) candle
- The second candle remains within the open and close of the first
This structure suggests weakening selling pressure and the possibility of a shift toward bullish momentum.
Bearish Harami
- Forms during an uptrend
- First candle: Large bullish (green) candle
- Second candle: Smaller bearish (red) candle
- The second candle is contained within the range of the first
This signals a potential loss of bullish strength and a possible move downward.
Important Structural Considerations
In classical candlestick theory, the second candle ideally forms with a gap inside the first candle. However, due to the 24-hour nature of the forex market, price gaps are relatively rare.
As a result:
- The second candle often appears as an inside bar rather than a true gap
- This variation remains valid and widely accepted in forex analysis
A third candle commonly referred to as the confirmation candle, is crucial. It determines whether the pattern leads to a reversal or continues the prevailing trend.
The ability of the Harami pattern to provide early signals with relatively tight stop loss placement makes it particularly effective for achieving favorable risk-reward ratios.
Uses of the Harami Candle in Forex Trading
Advantages
- Simple and easy to identify on charts
- Offers early entry opportunities with controlled risk
- Supports high risk-to-reward ratio setups
- Widely applicable across forex pairs and timeframes
Limitations
- Requires confirmation before trade execution
- Less reliable when used without supporting analysis tools
From an expert standpoint, the Harami pattern should never be traded in isolation. Its effectiveness increases significantly when combined with broader technical context.
How to Trade Using the Harami Pattern
The Harami pattern generates both bullish and bearish signals depending on its formation and confirmation. Understanding context and validation is essential for accurate interpretation.
Bullish Harami Example
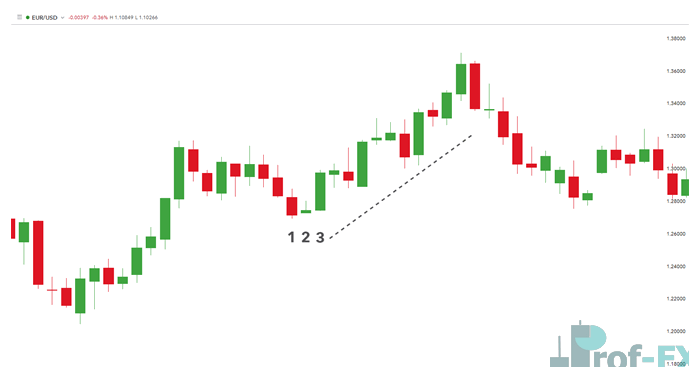
In this scenario, the Bullish Harami appears within an upward trend in the EUR/USD pair, acting as a continuation signal rather than a reversal.
This highlights a critical principle:
Not all Harami patterns indicate reversals, some reinforce the existing trend.
Traders typically:
- Wait for confirmation from the third candle
- Enter long positions if bullish momentum continues
- Place stop loss below the pattern structure
Bearish Harami Example
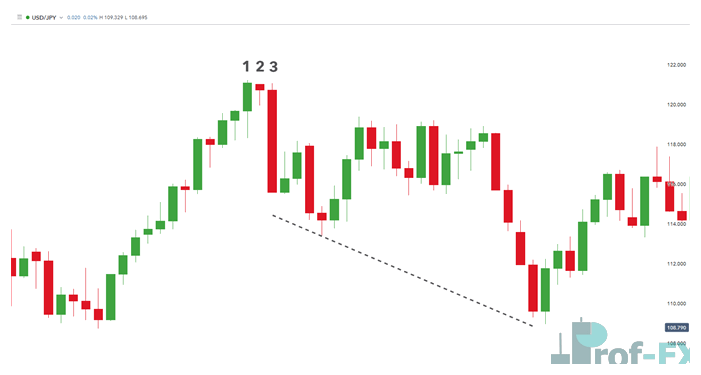
In this case, the Bearish Harami forms near a medium-term high, signaling a potential trend reversal.
Reversal signals tend to be more reliable when they occur at:
- Key resistance levels
- Previous highs or lows
- Established support and resistance zones
After confirmation, traders may:
- Enter short positions
- Place stop loss above the pattern
- Target lower price levels aligned with market structure
The Importance of Context in Harami Trading
Context is a decisive factor when interpreting the Harami pattern.
Traders must evaluate:
- The prevailing trend direction
- Surrounding price action
- Key technical levels (support/resistance)
- Market structure and momentum
Without this broader analysis, the Harami pattern is reduced to a simple three-candle formation with limited predictive value.
A structured approach ensures that trades are based on probability rather than isolated signals.
Best Practices for Trading Harami Candlesticks
To maximize effectiveness:
- Always wait for a confirmation candle
- Combine with technical indicators (e.g., RSI, moving averages)
- Analyze multiple timeframes for trend alignment
- Focus on strong market zones (support and resistance)
- Maintain disciplined risk management with proper position sizing
Conclusion: Leveraging the Harami Pattern for Strategic Trading
The Harami candlestick pattern is a versatile and powerful tool for identifying both reversals and continuations in forex trading. Its structured formation, combined with confirmation and contextual analysis, provides traders with a clear framework for decision-making.
When used alongside supporting indicators and sound risk management, the Harami pattern enables traders to enter the market with precision and confidence. In professional trading environments, this level of structured analysis is essential for achieving consistent and sustainable results.