The Average Directional Index (ADX) Indicator
Identifying trends is one of the most persistent challenges in trading. The difficulty lies in the fact that defining a trend is inherently subjective, what appears to be a clear trend to one trader may not meet the criteria of another. This subjectivity can lead to significantly different strategic decisions, even when analyzing the same market conditions.
While tools such as moving averages or price action analysis can assist in determining whether a market is trending, there is a dedicated technical indicator specifically designed for this purpose: the Average Directional Index (ADX).
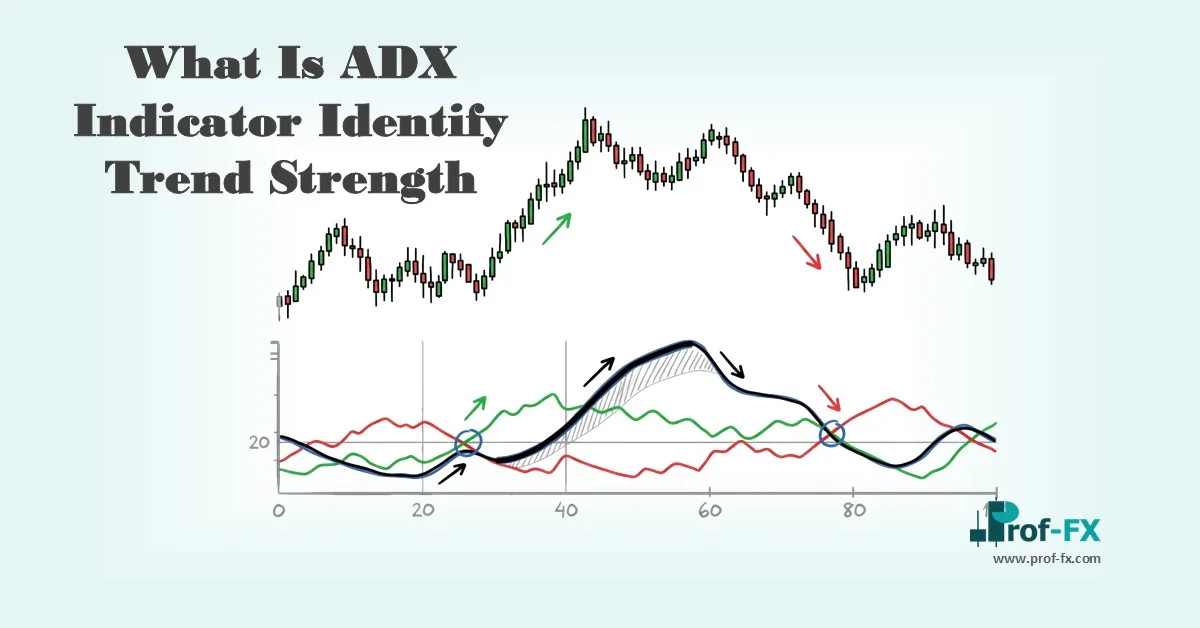
The ADX was developed by J. Welles Wilder, who also introduced other foundational technical indicators such as the Relative Strength Index (RSI), Average True Range (ATR), and Parabolic SAR. The primary objective of ADX is to measure trend strength, providing traders with insight into whether a current market move has the potential to continue.
The indicator is displayed in a separate panel below the price chart. Its behavior is directly tied to market conditions: during strong trends, ADX values increase, while in ranging or mean-reverting markets, the indicator tends to decline. This relationship makes ADX a highly effective tool for distinguishing between trending and non-trending environments.
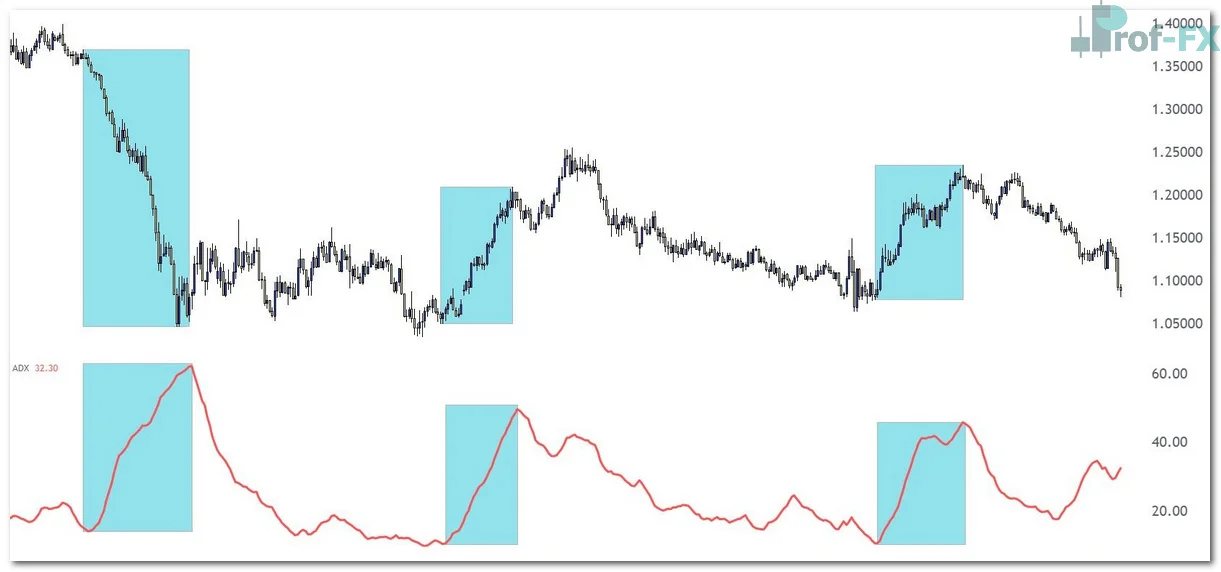
On the weekly EUR/USD chart below, ADX is applied beneath price action. Notice how the indicator rises during sustained directional moves, reflecting strengthening trends across multiple phases of the market.
EUR/USD Weekly Price Chart
HOW TO USE ADX
Unlike many technical indicators that attempt to provide multiple signals simultaneously, ADX is intentionally focused on a single function: evaluating trend strength. This specialization enhances its reliability by eliminating unnecessary complexity and reducing conflicting signals.
The interpretation is straightforward:
- Higher ADX values indicate stronger trends
- Lower ADX values suggest weak or non-existent trends
From a professional trading perspective, ADX is not designed to generate entry signals or identify overbought and oversold conditions. Instead, it serves as a contextual tool helping traders assess whether current market conditions are suitable for trend-following strategies or alternative approaches.
One of the most widely used methods of applying ADX is through a cut-off value. This threshold acts as a benchmark for determining whether a trend is sufficiently strong:
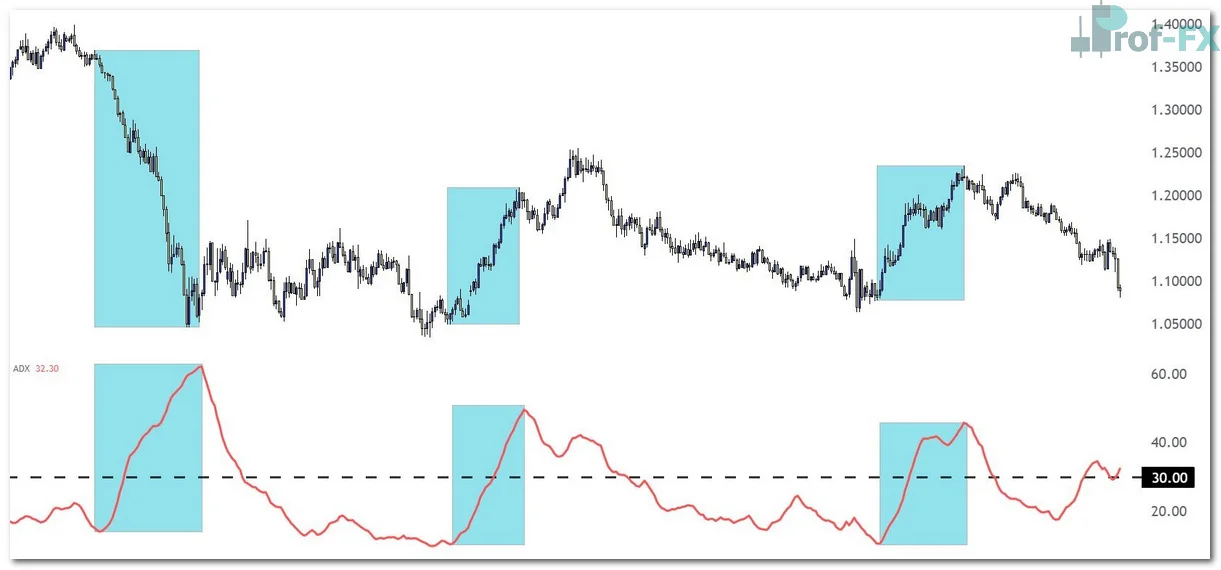
- When ADX rises above 30, it signals that a meaningful trend is in place
- When ADX remains below 30, the market is generally considered to be range-bound or lacking directional strength
This framework allows traders to align their strategy with market conditions. For example:
- When ADX is above 30, traders may prioritize trend-following strategies, aiming to capitalize on sustained directional movement.
- When ADX is below 30, traders may shift toward range trading or breakout strategies, adapting to lower momentum environments.
In the chart below, a horizontal line is placed at the 30 level on the ADX indicator, using the same EUR/USD weekly timeframe. This visual threshold clearly separates trending conditions from non-trending phases, providing a structured decision-making framework.
EUR/USD Weekly Price Chart with ADX Applied
STRATEGIC INSIGHT
The Average Directional Index is most effective when used as a market condition filter rather than a standalone trading signal. Its ability to objectively measure trend strength allows traders to make informed decisions about strategy selection, improving consistency and reducing exposure to unfavorable conditions.
From an expert standpoint, the disciplined use of ADX enhances trading precision. By confirming whether a market is trending or consolidating, traders can avoid misaligned strategies and focus on setups that are statistically more favorable.
In conclusion ADX is not about predicting price direction, it is about understanding the strength behind price movement. When applied correctly, it becomes a critical component in building a structured, adaptive, and professional trading approach.