


One of the most overlooked skills is patience. Markets do not move in a constant state of action. Instead, they alternate between expansion (strong moves) and consolidation phases, where price “digests” prior movement.
These consolidation periods are not random, they often form structured patterns that traders can use to prepare for the next move. One of the most effective and widely observed of these patterns is the triangle formation.
Understanding Market “Digestion”
After a strong price move, market participants begin to:
- Take profits
- Reassess positions
- Enter counter-trend trades
This creates a temporary balance between buyers and sellers, reducing volatility and forming consolidation structures.
This phase is critical. It is not inactivity, it is preparation for the next directional move.
What Is a Triangle Pattern?
A triangle is a price action formation defined by:
- One horizontal level (support or resistance)
- One sloping trendline (rising or falling)
There are two primary types:
- Ascending Triangle → Horizontal resistance + higher-lows
- Descending Triangle → Horizontal support + lower-highs
The defining characteristic is pressure building toward a breakout.
USD/JPY Daily Price Chart
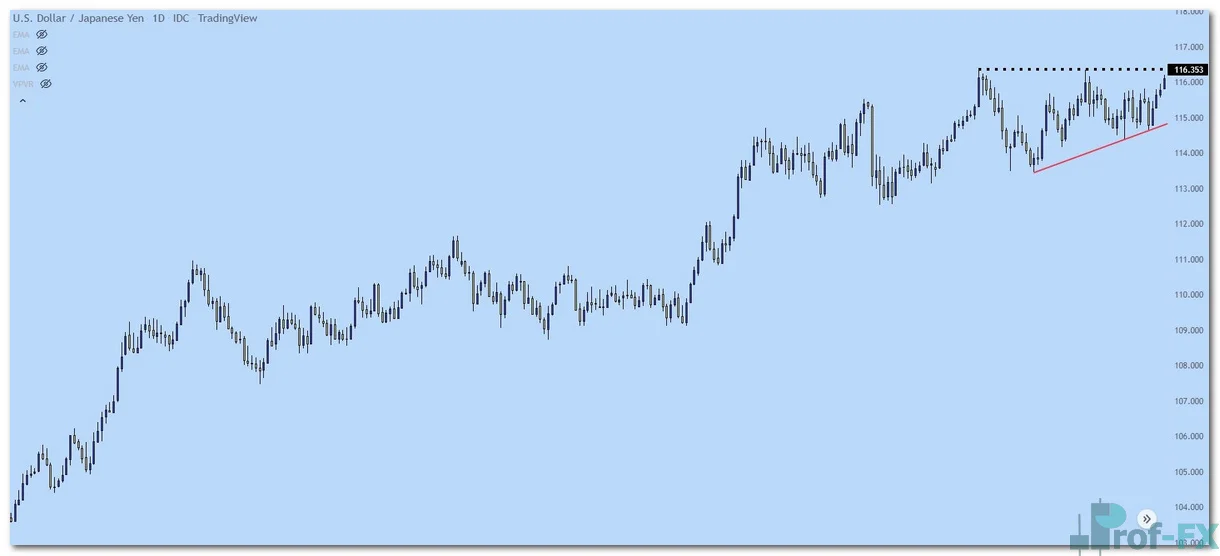
In the example above, price repeatedly tests a resistance level while forming higher-lows. This creates an ascending triangle, signaling that buyers are becoming increasingly aggressive.
The Logic Behind Triangle Formations
The key concept behind triangles is diminishing marginal impact.
Using the example:
- First test of resistance → strong rejection
- Second test → weaker rejection
- Third test → buyers gain control
Each test absorbs more opposing orders. Over time:
- Sellers at resistance become exhausted
- Buyers gain confidence
- Breakout probability increases
This is not coincidence, it reflects the gradual shift in order flow.
Breakout from the Triangle
As the pattern matures, price compresses toward the apex. Eventually, one side overpowers the other, resulting in a breakout.
USD/JPY Daily Price Chart
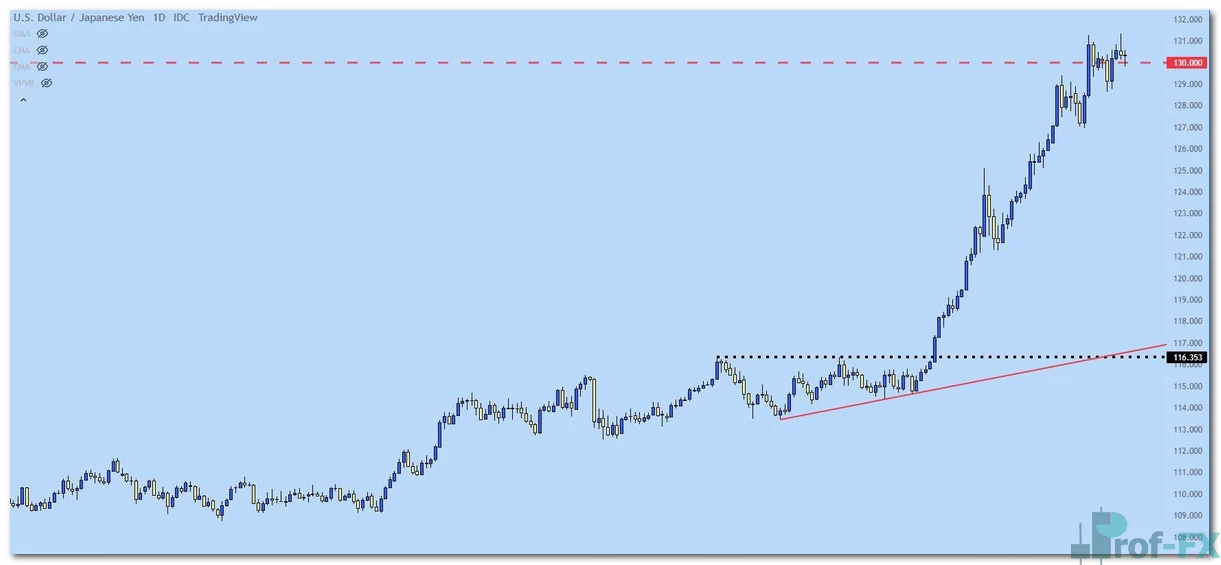
In this case, buyers finally push through resistance, triggering a strong bullish breakout. This confirms that demand has overtaken supply at that level.
Why Traders Fail During Breakouts
Many traders struggle with triangle breakouts due to:
- Entering too early (before confirmation)
- Chasing price after the breakout
- Ignoring the buildup phase
This often leads to buying highs or selling lows driven by emotion rather than structure.
A professional approach focuses on:
- Recognizing the consolidation phase
- Understanding the buildup of pressure
- Waiting for confirmation before acting
Triangle vs. Wedge: Key Differences
While triangles and wedges may appear similar, their structure and implications differ.
Triangle:
- Includes a horizontal level
- Suggests a breakout through that level
- Reflects pressure building against a fixed barrier
Wedge:
- Both boundaries are sloped
- Indicates weakening momentum
- Often precedes reversals rather than breakouts
In triangles, the horizontal level is expected to break with persistence. In wedges, the structure often signals exhaustion.
Practical Application in Trading
To trade triangle patterns effectively:
1. Identify the structure
- Horizontal support/resistance
- Converging trendline
2. Observe price behavior
- Are reactions weakening?
- Are higher-lows or lower-highs forming?
3. Wait for breakout confirmation
- Avoid premature entries
4. Plan risk management
- Place stop beyond structure
- Define clear risk-reward
5. Avoid emotional trading
- Do not chase price after breakout
Key Takeaway
Triangle patterns represent controlled consolidation before expansion. They are not merely chart formations, they reflect the gradual shift in market dominance between buyers and sellers.
From a professional standpoint:
- Consolidation is preparation, not inactivity
- Repeated tests weaken support or resistance
- Breakouts are the result of accumulated pressure
- Patience during formation leads to precision in execution
Traders who understand and apply triangle structures gain a significant advantage by positioning themselves before volatility expands, rather than reacting after it has already occurred.


