


Understanding the Bullish Harami in Price Action Trading
The bullish harami pattern is a well-known two-candlestick reversal formation that signals a potential shift from bearish to bullish momentum. In professional trading this pattern is not used in isolation, it becomes significantly more effective when combined with technical indicators, support levels, and overall market structure.
For beginner traders, the bullish harami offers a valuable early signal that a downtrend may be losing strength, potentially opening the door for a new upward move.
In this guide, we will cover:
- What the bullish harami pattern is
- How to identify it correctly on charts
- Practical strategies to trade it effectively
What Is a Bullish Harami Pattern?
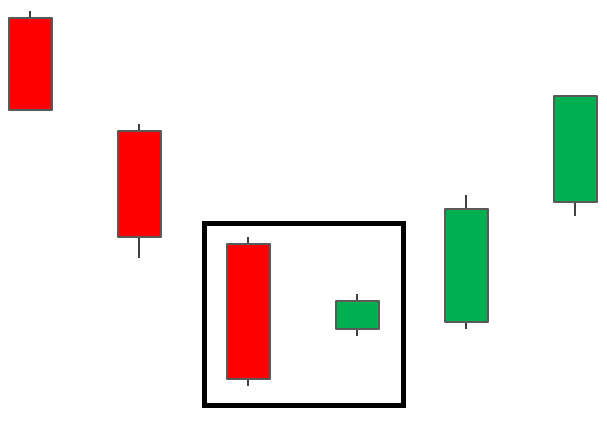
The bullish harami is a reversal pattern that forms at the bottom of a downtrend. It consists of two candles that reflect a transition in market sentiment.
Structure of the Pattern
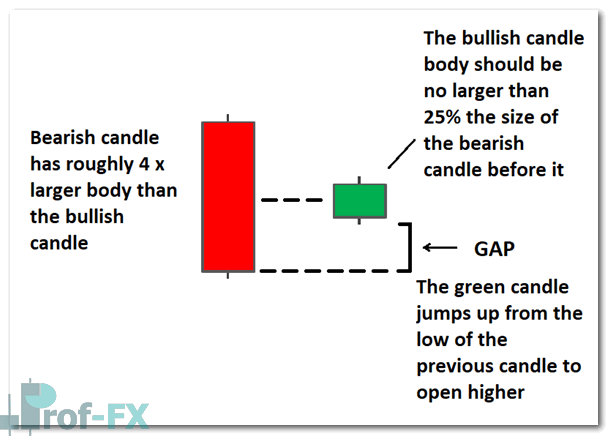
- The first candle is a large bearish (red) candle, showing strong selling pressure
- The second candle is a small bullish (green) candle, completely contained within the body of the first candle
This smaller candle represents a pause in momentum, suggesting that sellers are losing control and buyers may be preparing to step in.
A key feature of this pattern is that the second candle often opens near the mid-range of the previous candle, creating a subtle shift in sentiment.
The opposite formation is the bearish harami, which appears at the top of an uptrend and signals a potential downward reversal.
The Bullish Harami Cross: A Stronger Signal
A variation of this pattern, known as the bullish harami cross, occurs when the second candle is a Doji.
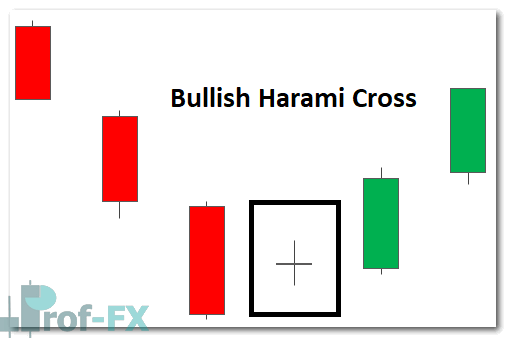
The Doji reflects market indecision, which is particularly significant at the end of a downtrend. It indicates that selling pressure has weakened, increasing the likelihood of a bullish reversal.
From a risk management perspective, this setup is attractive because:
- The potential trend reversal is still in its early stages
- Stop-loss levels can be kept relatively tight
- Risk-to-reward ratios can be optimized
How to Identify a Bullish Harami on Trading Charts
While the appearance of the bullish harami may differ slightly between forex markets and stock charts, the underlying principles remain the same.
Bullish Harami Identification Checklist
To confidently identify this pattern, follow these steps:
- Confirm a clear downtrend is in place
- Look for signs of slowing bearish momentum (e.g., RSI divergence, stochastic signals, or bullish crossover)
- Ensure the second candle’s body is small (ideally ≤25%) of the previous bearish candle
- Verify that the entire second candle is contained within the first candle’s body
- Seek confluence with support levels or indicators
Bullish Harami in Forex vs Stock Markets
Understanding how this pattern forms across different markets is essential for accurate interpretation.
Formation in the Forex Market
The forex market operates nearly 24 hours a day, which means price gaps are rare under normal conditions.
As a result:
- The second candle often opens near the previous candle’s close
- The pattern appears more continuous and compact
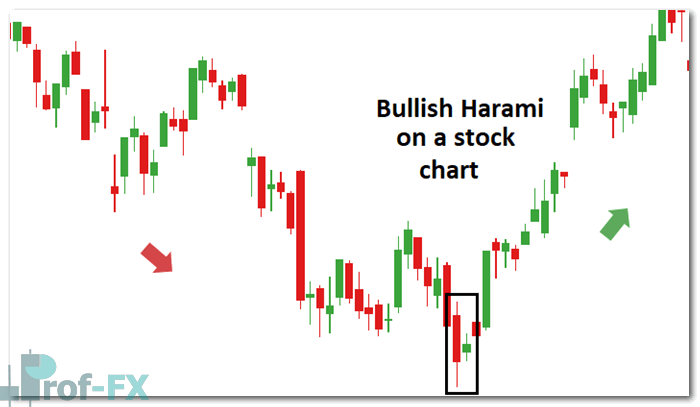
Formation on Stock Charts
In contrast, stock markets such as those tracking companies like Société Générale (GLE FP) on the CAC 40 often experience price gaps.
These gaps may occur due to:
- Company news releases
- Economic data
- Mergers or acquisition rumors
- Broader market sentiment
This causes the bullish harami pattern to appear with visible spacing between candles, making it more pronounced.
How to Trade the Bullish Harami Pattern
To trade the bullish harami effectively, traders should combine pattern recognition with confirmation signals.
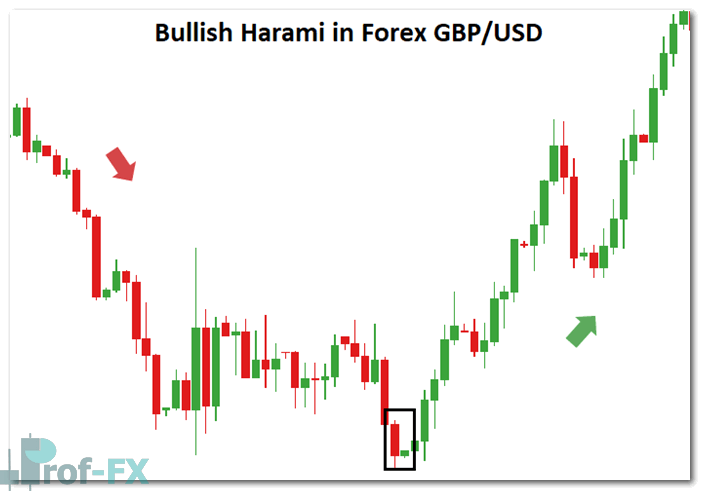
Practical Trade Example (GBP/USD)
Let’s break down a typical setup:
- A clear downtrend is established
- A bullish hammer appears before the harami, signaling early rejection of lower prices
- The second candle is small and fully contained within the previous candle
- The Relative Strength Index (RSI) indicates an oversold condition
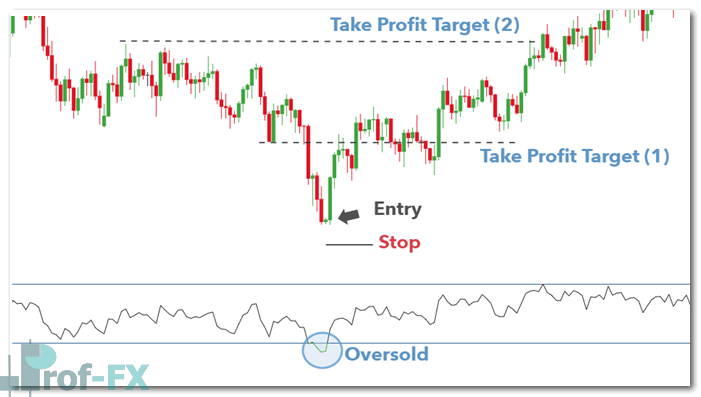
Trade Execution
Entry:
Enter at the open of the candle following the completion of the bullish harami pattern, ideally after confirmation.
Stop Loss:
Place the stop loss below the recent swing low or the lowest point of the pattern.
Take Profit:
Set targets at nearby resistance levels. Since the pattern can mark the start of a new uptrend, consider:
- Multiple take-profit levels
- Trailing stop strategies
How Reliable Is the Bullish Harami?
Like all candlestick patterns, the bullish harami’s reliability depends heavily on context and confirmation.
Advantages
- Provides early entry opportunities in a potential uptrend
- Offers favorable risk-to-reward ratios
- Easy to identify, especially for beginners
Limitations
- Should not be traded in isolation
- Requires confirmation from indicators or price structure
- Must appear at the end of a downtrend to be valid
Common supporting indicators include:
- RSI (Relative Strength Index)
- Stochastic Oscillator
Final Thoughts on Bullish Harami Trading Strategy
The bullish harami pattern is a subtle but powerful signal that reflects a shift in market psychology, from strong selling pressure to emerging buying interest.
At its core, the pattern tells this story:
The market pauses after a strong decline, and buyers begin to quietly take control.
When combined with:
- Support and resistance levels
- Momentum indicators
- Broader trend analysis
…it becomes a valuable addition to any trader’s strategy.
Continue Learning Candlestick Trading
The bullish harami is just one of many patterns that can enhance your trading edge. To build consistency, traders should also study:
- Bullish Engulfing pattern
- Hammer and Morning Star patterns
- Multi-timeframe analysis
- Risk management principles
Mastery in trading comes from combining pattern recognition, confirmation tools, and disciplined execution.


