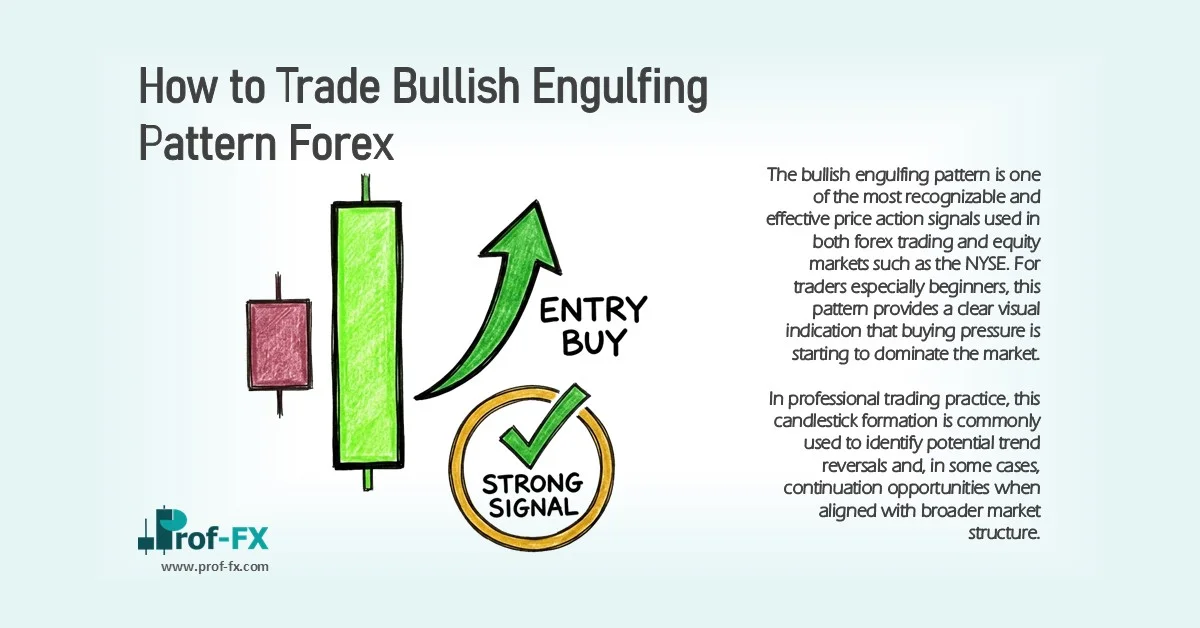
Understanding the Bullish Engulfing Pattern in Trading
The bullish engulfing pattern is one of the most recognizable and effective price action signals used in both forex trading and equity markets such as the NYSE. For traders especially beginners, this pattern provides a clear visual indication that buying pressure is starting to dominate the market.
In professional trading practice, this candlestick formation is commonly used to identify potential trend reversals and, in some cases, continuation opportunities when aligned with broader market structure.
In this guide, we will explore:
- What the bullish engulfing pattern is
- How to identify and interpret it correctly
- Practical strategies to trade it in forex and stock markets
What Is a Bullish Engulfing Pattern?
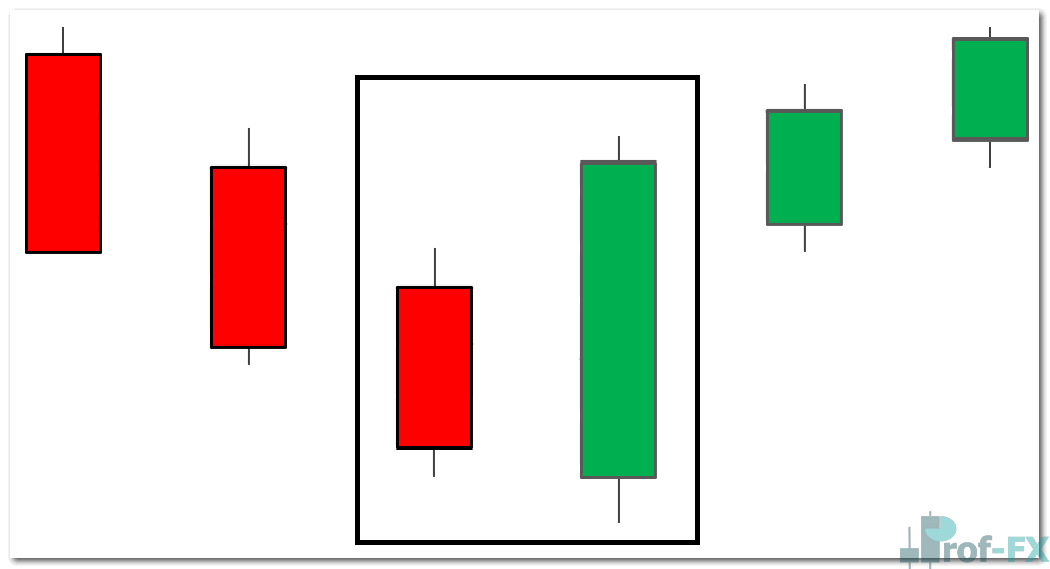
A bullish engulfing candle typically forms at the bottom of a downtrend and signals a potential shift from bearish to bullish momentum.
This pattern consists of two candles:
- The first candle is bearish (red), reflecting ongoing selling pressure
- The second candle is bullish (green) and completely engulfs the body of the first candle
This shift indicates that buyers have stepped in aggressively, overwhelming sellers and potentially initiating a new upward trend.
Candle Structure Breakdown
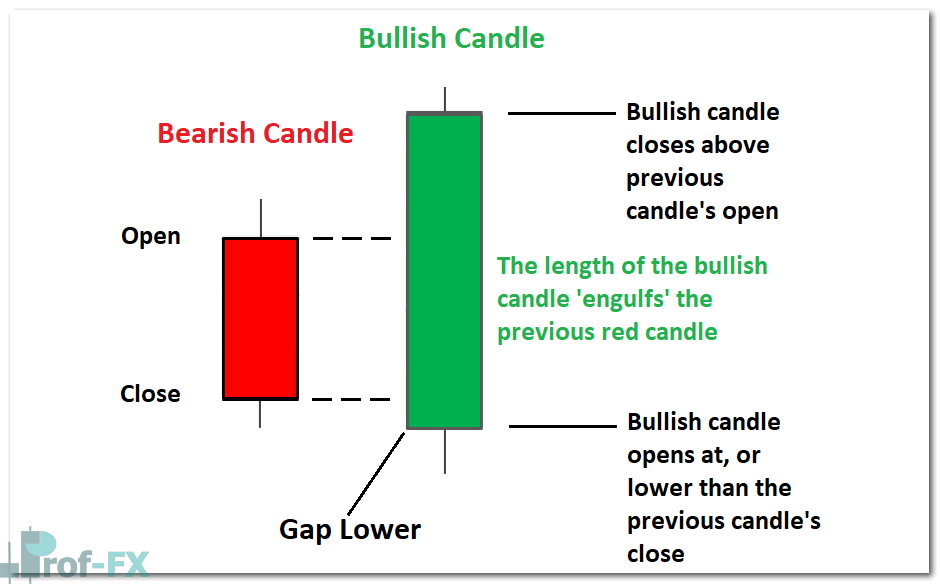
The strength of this pattern lies in its clear transition of control:
- The market opens under bearish sentiment
- Buyers regain control and push prices higher
- The closing price exceeds the previous candle’s range
The larger the bullish candle, the stronger the signal tends to be.
How to Identify a Bullish Engulfing Pattern and What It Means
Recognizing this pattern correctly is essential for avoiding false signals and improving trade accuracy.
Key Characteristics
- A strong green candle that fully engulfs the previous red candle’s body (ignore wicks)
- Appears at the bottom of a downtrend
- Stronger confirmation when:
- The first candle is a doji (market indecision)
- Subsequent candles close above the high of the bullish candle
What Does This Pattern Tell Traders?
From a market psychology perspective, the bullish engulfing pattern reflects:
- A shift in momentum from sellers to buyers
- Weakening selling pressure at key levels
- The potential beginning of a bullish reversal
Advantages of Using This Pattern
One of the reasons this pattern is widely used across forex pairs like GBP/USD and stocks listed on the NYSE is its practicality:
- Easy to identify on any timeframe
- Provides clear entry and risk management levels
- Works well when combined with indicators and price structure
Bullish vs Bearish Engulfing Pattern: Avoiding Confusion
To trade effectively, it is important to clearly distinguish between bullish and bearish engulfing patterns.
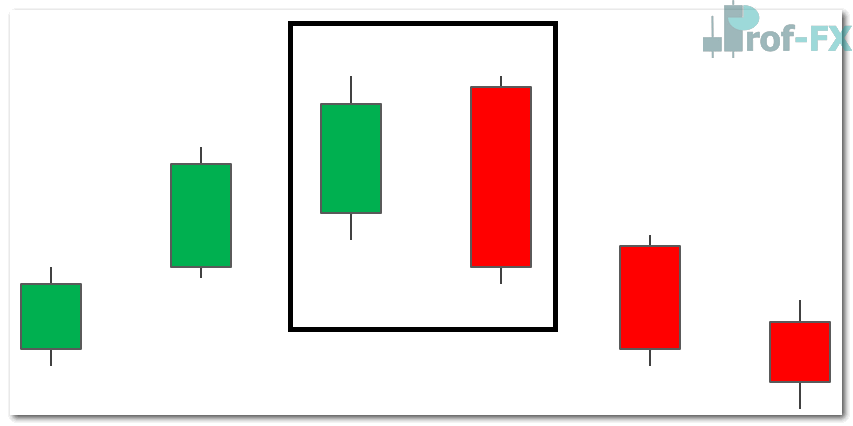
The bearish engulfing pattern is the opposite formation, appearing at the top of an uptrend and signaling potential downside movement.
Bearish Engulfing Example
Key Differences
| Engulfing Pattern | Characteristics | Location | Signal |
| Bullish Engulfing | Green candle engulfs smaller red candle | Bottom of downtrend | Bullish reversal |
| Bearish Engulfing | Red candle engulfs smaller green candle | Top of uptrend | Bearish reversal |
Understanding this distinction is critical to prevent entering trades in the wrong market direction.
How to Trade the Bullish Engulfing Pattern
While the pattern itself is powerful, professional traders always seek confirmation before entering a trade. This can come from indicators, support levels, or additional candlestick signals.
Strategy 1: Bullish Engulfing in Forex Trading
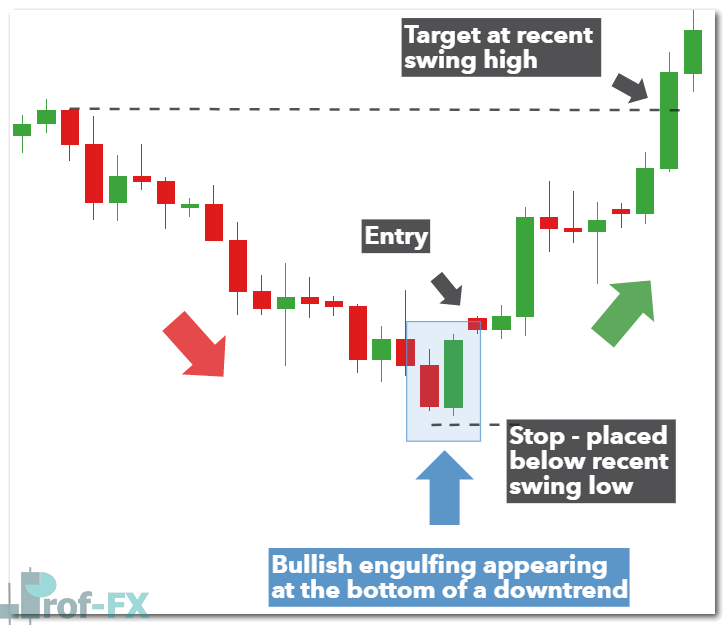
The GBP/USD daily chart provides a classic example of the bullish engulfing pattern forming after a downtrend.
Trade Setup Example
Entry:
Enter after confirmation typically when the next candle closes above the high of the bullish engulfing candle.
Stop Loss:
Place the stop below the low of the bullish engulfing pattern. This level invalidates the trade if broken.
Take Profit:
Set the target at a previous resistance level or recent swing high. This ensures a favorable risk-to-reward ratio.
This approach aligns with core principles of technical analysis, where price reacts to historical levels.
Strategy 2: Applying Bullish Engulfing in Stock Trading
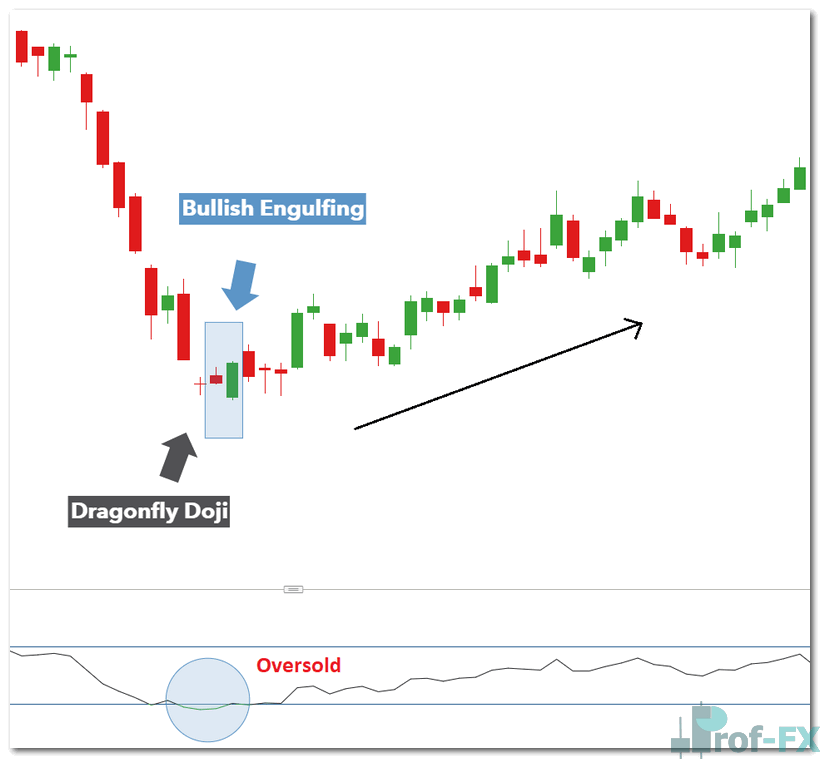
The bullish engulfing pattern is not limited to forex, it is also widely used in stock trading, including companies listed on the NYSE, such as FedEx Corp (FDX).
Combining with Indicators for Stronger Confirmation
In this example:
- A Dragonfly Doji appears before the engulfing pattern
- This signals rejection of lower prices
- The Relative Strength Index (RSI) shows an oversold condition
These combined signals significantly strengthen the bullish bias and improve trade confidence.
Trade Setup Example
Entry:
Enter after the bullish engulfing candle is confirmed with supporting signals.
Stop Loss:
Place the stop below the recent swing low (e.g., the Dragonfly Doji low).
Take Profit:
Target a previous resistance level where price has reacted before, ensuring a positive risk-to-reward ratio.
Final Thoughts on Bullish Engulfing Trading Strategy
The bullish engulfing pattern is a high-probability price action signal, especially when it appears at key levels and is supported by:
- RSI (Relative Strength Index)
- Support and resistance zones
- Additional candlestick patterns (e.g., Doji)
As a trader, your focus should not only be on spotting patterns but also on understanding the underlying market psychology. This pattern clearly signals that:
Sellers are losing control, and buyers are stepping in with strength.
Continue Learning and Improving Your Trading Skills
To build long-term consistency in trading, consider expanding your knowledge in:
- Candlestick pattern recognition
- Multi-timeframe analysis
- Risk management and trade planning
The bullish engulfing pattern is just one tool, but when used correctly within a structured trading plan, it can become a powerful part of your overall strategy.