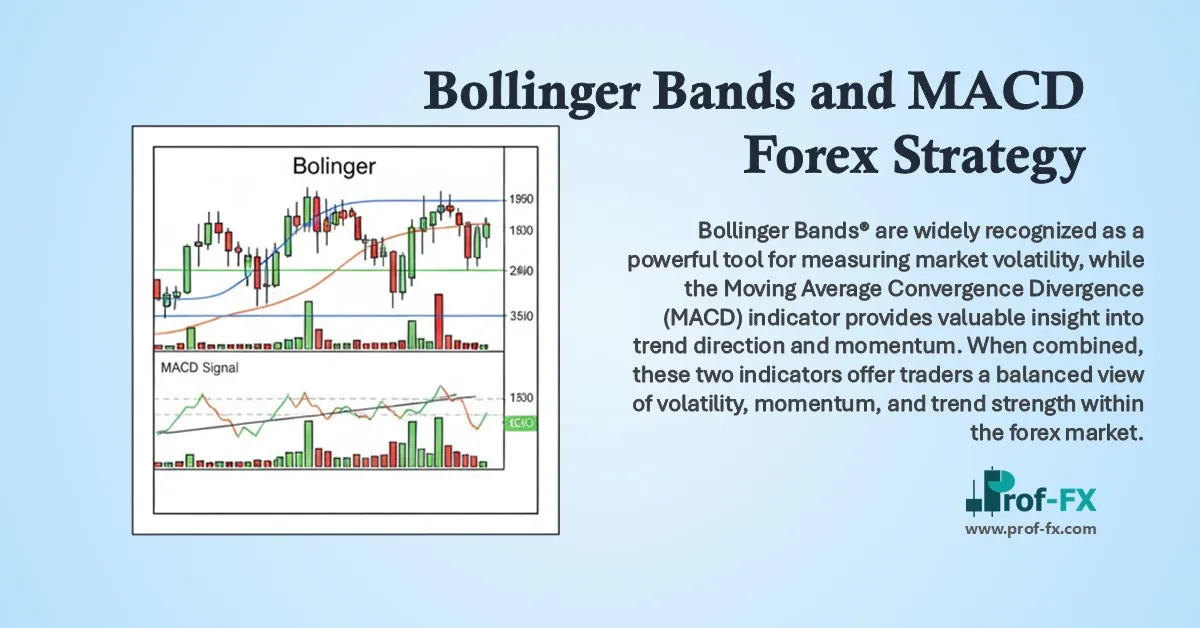
Bollinger Bands® are widely recognized as a powerful tool for measuring market volatility, while the Moving Average Convergence Divergence (MACD) indicator provides valuable insight into trend direction and momentum. When combined, these two indicators offer traders a balanced view of volatility, momentum, and trend strength within the forex market.
Before applying this strategy, traders should have a basic understanding of how Bollinger Bands® and MACD function individually. When used together correctly, they can support higher-probability trade setups and more disciplined decision-making.
In this article, we will explore:
- What the Bollinger Bands® and MACD combination is
- How to trade forex using Bollinger Bands® and MACD
- The advantages and limitations of this combined trading system
Understanding the Bollinger Bands® and MACD Combination
As the name suggests, this strategy involves using Bollinger Bands® alongside MACD to support trade setups. Each indicator plays a distinct role.
Bollinger Bands® visually represent market volatility, expanding during periods of high volatility and contracting during consolidation. MACD, on the other hand, is a trend-following momentum indicator that helps traders assess whether momentum is strengthening or weakening.
When combined, these indicators allow traders to:
- Identify the direction of the trend
- Evaluate the strength of momentum
- Recognize changes in volatility that may precede breakouts
MACD helps determine whether momentum is accelerating or slowing, while Bollinger Bands® assist with entry timing and confirmation as volatility expands or contracts.
How to Trade Forex Using Bollinger Bands® and MACD
There are several ways to apply these indicators together. However, two of the most effective and commonly used approaches are:
- Bollinger Band® breakout trading
- Trend trading with Bollinger Bands® and MACD
Each approach serves a different market condition but relies on the same core indicators.
Bollinger Band® Breakout Strategy Using MACD
Traders looking to capture breakouts can follow a structured process using both indicators.
First, identify a trending or compressed market using MACD. Pay close attention to MACD histogram divergence, which may signal that momentum is slowing and a breakout could be approaching.
Next, watch for price to break above or below the 20-period moving average, which forms the center line of the Bollinger Bands®. This often acts as an early signal that price is shifting direction.
Confirmation comes when price breaches the outer Bollinger Band®, accompanied by expanding bands and increasing MACD histogram size—evidence of rising volatility and strengthening momentum.
GBP/NZD Breakout Example
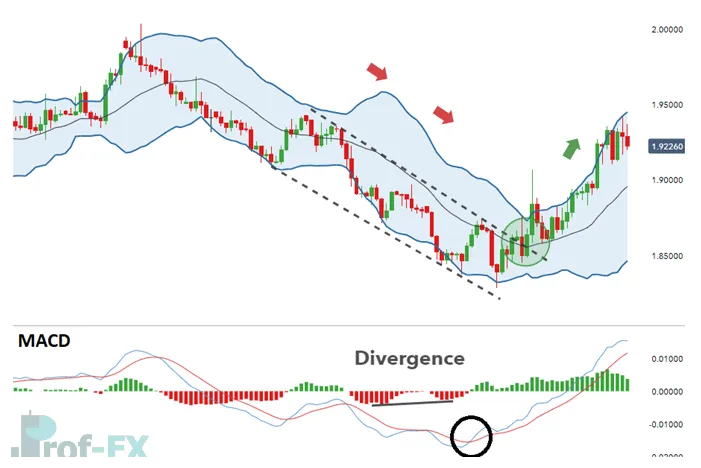
In the GBP/NZD chart, price trades within a descending channel during a strong downtrend. As downward momentum slows, bullish divergence appears on the MACD histogram. A break above the 20-period moving average signals a potential long entry.
The breakout is reinforced as price breaks both trendline resistance and the Bollinger Band® midline simultaneously—confirming the significance of the move. MACD further validates the setup as the MACD line crosses above the signal line, indicating growing bullish momentum.
Stops can be placed below the lower Bollinger Band® or beneath the channel low. Targets may be set near prior resistance levels while maintaining a positive risk-to-reward ratio. Traders may also trail stops if the breakout develops into a full trend reversal.
Trend Trading with Bollinger Bands® and MACD
This indicator combination can also be highly effective in established trending markets.
The process begins by using MACD as a trend filter. When the MACD line is above the signal line—and both are above the zero line—traders should focus exclusively on long positions. The opposite applies in downtrends.
Once the trend is confirmed, traders look for pullbacks toward the 20-period moving average as potential entry points. MACD should continue to show supportive momentum, even if temporary consolidation occurs.
EUR/USD Trend Trading Example
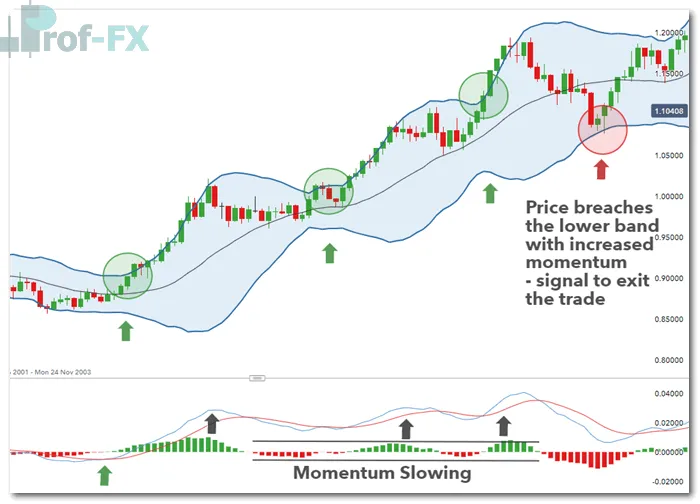
In the EUR/USD example, MACD confirms a strong uptrend. Although momentum temporarily slows and MACD lines briefly converge, price does not reverse significantly. Instead, price repeatedly bounces off the 20 MA, continuing to form higher highs and higher lows.
Entries can be aligned with periods of Bollinger Band® contraction followed by expansion, often referred to as a Bollinger Band® squeeze. Traders may exit positions when price returns to the 20 MA or breaches the opposite Bollinger Band®.
Stops can trail along the lower Bollinger Band® in an uptrend, while profit targets may be set near key support and resistance levels, ensuring disciplined risk management.
Advantages and Limitations of the Bollinger Bands® and MACD Strategy
Advantages
Bollinger Bands® and MACD can be applied to any forex pair, asset class, or timeframe.
Bollinger Bands® naturally provide logical stop-loss placement based on volatility.
Traders can quickly assess trend direction and volatility at a glance.
Limitations
This strategy may be challenging for beginner traders without prior indicator knowledge.
Bollinger Bands® perform best in ranging or transitioning markets, while MACD follows trends—misalignment can produce mixed signals if applied incorrectly.
Further Reading on Bollinger Bands® and Volatility
Bollinger Bands® offer a clear visual representation of market volatility and price extremes. To deepen your understanding:
- Learn how to apply this indicator when trading forex with Bollinger Bands®
- Explore additional tools for measuring volatility in our guide to technical indicators explained for forex traders
About Prof FX
Prof FX provides professional forex news, technical analysis, and educational content focused on the trends shaping global currency markets. Our mission is to help traders develop structured strategies, strong risk management, and long-term consistency.