Understanding Market Reversals in Forex Trading
Sustained uptrends are among the most favorable conditions for traders, offering consistent opportunities to capitalize on bullish momentum. However, no trend persists indefinitely. In forex trading, recognizing the transition from an uptrend to a potential downtrend is critical for protecting profits and identifying new trading opportunities.
This is where reversal patterns, particularly the hanging man candlestick, become essential. Understanding how and when this pattern forms enables traders to anticipate bearish reversals and manage risk with precision.
What Is the Hanging Man Candlestick Pattern?
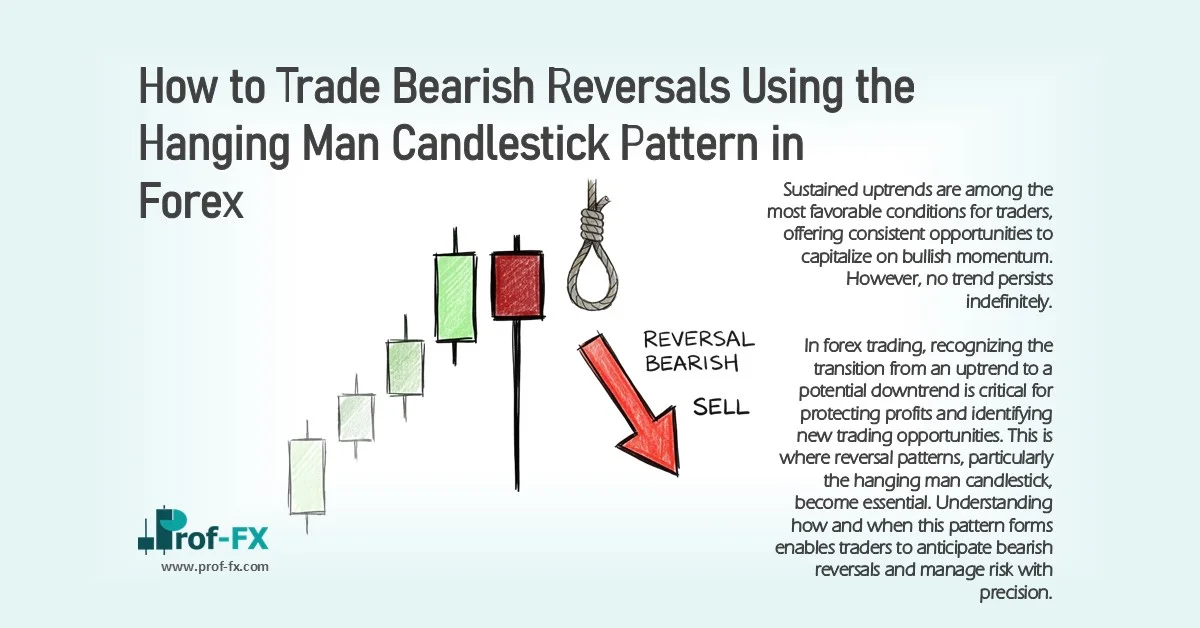
The hanging man is a bearish reversal candlestick pattern that appears at the top of an established uptrend. It signals a sudden and significant increase in selling pressure, often indicating that the market may have reached a temporary or long-term peak.
This shift typically occurs when market participants begin to perceive the current price level as overvalued, resulting in increased selling activity. As a consequence, bearish sentiment begins to outweigh bullish momentum.
In practical chart analysis, this pattern often appears as a red (bearish) candle at the peak of an upward trend, reflecting strong rejection of higher prices.
GBP/USD Hanging Man Example
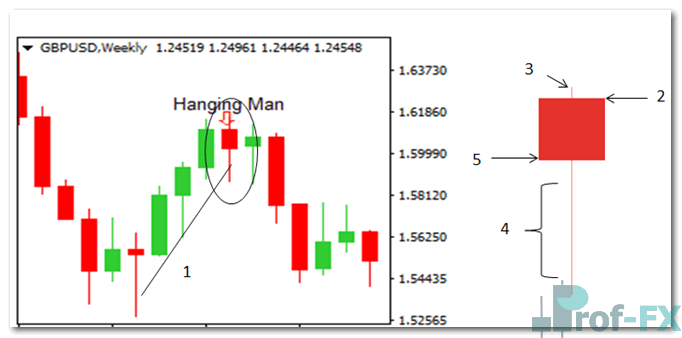
Key Characteristics of the Hanging Man Candle
The reliability of the hanging man pattern depends on its structural components and its position within the trend.
- Trend Context: The pattern must form at the top of a clear uptrend to be considered valid
- Real Body: Small in size, indicating limited price movement between open and close
- Upper Shadow (Wick): Minimal or absent, suggesting weak continuation attempts by buyers
- Lower Shadow: At least twice the length of the body, highlighting strong intraperiod selling pressure
- Closing Price: A close below the open strengthens the bearish signal
The long lower wick is particularly significant, as it reveals aggressive selling during the session, even if buyers partially recover before the close. This imbalance is a key early warning of weakening bullish control.
Identifying Valid Hanging Man Trading Signals
The hanging man pattern alone is not sufficient for confirmation. Its validity is strengthened by subsequent price action.
A high-probability bearish signal typically includes:
- A follow-up candle that closes lower
- A break below a short-term upward trendline
- Price moving below the low of the hanging man candle
These confirmations indicate that selling pressure is continuing and that the market is transitioning into a bearish phase. Traders often interpret this as an opportunity to initiate short positions.
How to Trade the Hanging Man Pattern Effectively
A structured, multi-step approach ensures that trades based on the hanging man pattern are both disciplined and data-driven.
Step 1: Identify the Long-Term Trend
Begin with a higher timeframe chart (daily or weekly) to determine the dominant market direction. Trading against the broader trend significantly reduces probability of success.
Step 2: Locate the Optimal Entry Point
Switch to a lower timeframe (such as 4-hour or 2-hour charts) to refine your entry. The hanging man pattern serves as an early signal for a potential bearish reversal.
Step 3: Confirm with Technical Indicators
Strengthen the setup by incorporating additional tools:
- RSI (Relative Strength Index): Look for bearish divergence or downward movement
- Moving Averages (e.g., 20 SMA crossing below 50 SMA)
- Fibonacci retracement levels
- Presence near key support and resistance zones
Confluence between these indicators increases the reliability of the signal.
Step 4: Execute the Trade
A common entry strategy is to place a sell (short) order once price breaks below the low of the hanging man candle. This confirms that bearish momentum is taking control.
Step 5: Apply Risk Management
Risk management is non-negotiable in forex trading:
- Define position size based on your overall account balance
- Limit risk exposure per trade (commonly below 5%)
- Place stop loss above the high of the hanging man candle or nearby resistance
This approach ensures capital preservation even in unfavorable market conditions.
Step 6: Define Exit Strategy (Take Profit)
A minimum risk-to-reward ratio of 1:2 is strongly recommended. This means:
- Potential reward should be at least double the risk taken
By maintaining this ratio, traders can remain profitable even with a moderate win rate, reinforcing long-term account growth.
Practical Example: Hanging Man on GBP/USD
Daily Chart – Downtrend Context
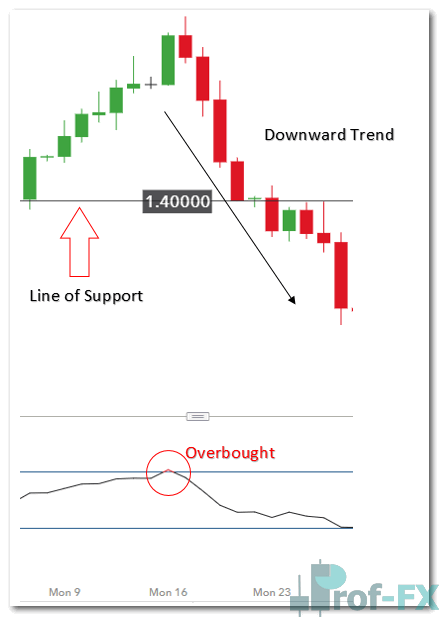
A higher timeframe analysis reveals a broader bearish trend, providing directional bias for short trades.
4-Hour Chart – Entry Confirmation
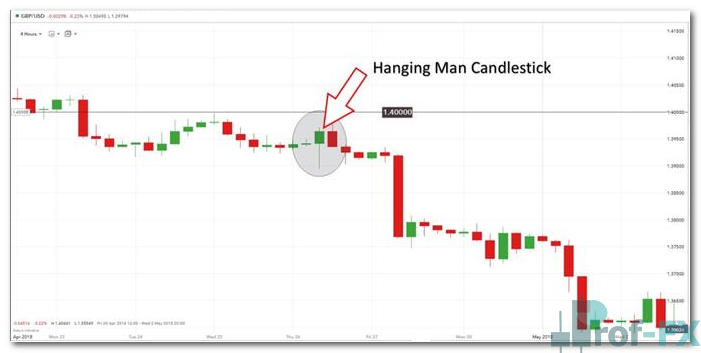
On the lower timeframe:
- Previous support at 1.40000 becomes resistance
- The hanging man forms near the peak of a short-term uptrend
- Price subsequently breaks below the candle’s low, confirming a bearish entry
A logical stop loss placement would be above the 1.40000 resistance level, ensuring controlled risk exposure.
Key Confirmation Signals for a Valid Trade
A strong hanging man setup typically includes:
- A dominant long-term downtrend
- Formation at the peak of a short-term uptrend
- Alignment with significant support/resistance levels
- Clear bearish follow-through (lower highs and lower lows)
When these conditions align, the probability of a successful trade increases substantially.
Frequently Asked Questions (FAQs)
In Which Markets Does the Hanging Man Pattern Appear?
The hanging man pattern can form in all financial markets. However, it is particularly common in forex due to the market’s high liquidity and trading volume, which exceeds trillions of dollars daily. This liquidity enhances the reliability of price action patterns.
How Do You Identify Strong Support and Resistance Levels?
Support and resistance levels represent price zones where the market has historically reversed or stalled. These levels are identified by:
- Repeated price reactions at specific zones
- Previous highs and lows
- Psychological price levels
Accurate identification of these zones is critical for timing entries, exits, and stop placements.
How Can You Strengthen Hanging Man Signals?
To improve accuracy:
- Combine the pattern with technical indicators
- Look for confluence with key levels
- Confirm with subsequent bearish price action
Relying solely on the candlestick without confirmation increases the risk of false signals.
Conclusion: Trading Reversals with Confidence and Precision
The hanging man candlestick pattern is a powerful tool for identifying potential bearish reversals at the top of an uptrend. However, its effectiveness depends on proper context, confirmation, and disciplined execution.
Traders who combine candlestick analysis with multi-timeframe strategies, technical indicators, and strict risk management gain a measurable advantage in anticipating market reversals. In professional trading environments, this structured approach is not optional—it is essential for consistent performance.
Prof FX continues to provide in-depth forex analysis and insights to help traders navigate global currency markets with clarity and confidence.