


Markets, like most natural systems, operate in cycles. Expansion is typically followed by contraction, and this repeating process defines how price evolves over time. In financial markets, this cyclical behavior is driven by human decision-making reacting to information, sentiment, and expectations.
However, trends rarely develop in a straight line. Even in strong directional markets, price tends to move in waves rather than a continuous path. This behavior forms the foundation of price action trends, where structure not prediction guides trading decisions.
The Structure of Price Trends
A trend is best understood through its sequence of price movements:
- Uptrend (Bullish) → Higher-Highs and Higher-Lows
- Downtrend (Bearish) → Lower-Lows and Lower-Highs
This pattern reflects the balance between buyers and sellers:
- In an uptrend, buyers consistently step in earlier, pushing price to new highs
- In a downtrend, sellers dominate, forcing price to new lows
This movement is often described as:
“Two steps forward, one step back.”
The market advances in the direction of the trend but periodically retraces as participants take profits or reassess positions. These pullbacks are not weaknesses, they are essential components of a sustainable trend.
GBP/USD Daily Price Chart: Trend Structure
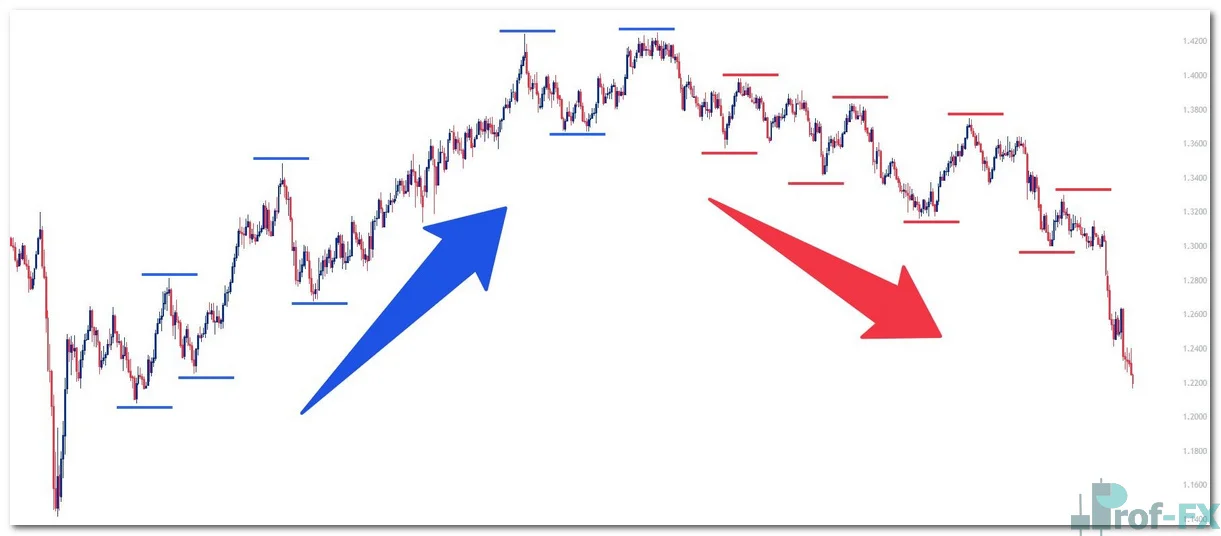
The chart above illustrates both bullish and bearish structures through sequences of higher-highs/higher-lows and lower-lows/lower-highs. These formations provide a clear, objective framework for identifying trend direction.
Why Trends Form
Trends are typically driven by new information entering the market. This could include:
- Strong economic data (e.g., GDP growth)
- Central bank policy changes
- Earnings reports or macroeconomic shifts
When positive information is introduced, it attracts buyers, pushing prices higher. However, once that information is fully priced in, buying pressure may temporarily fade, leading to a pullback.
If the underlying narrative remains valid, buyers re-enter before price fully retraces the prior move. This creates a higher-low, reinforcing the uptrend structure.
The same logic applies in reverse for bearish trends.
Momentum and Trend Strength
Not all trends develop at the same pace. The strength of a trend depends on how aggressively the market reacts to new information.
In some cases, price may move modestly, reflecting balanced sentiment. In others, strong conviction can lead to rapid expansion, resembling:
- “Ten steps forward, one step back”
This indicates strong momentum, where pullbacks are shallow and buyers or sellers remain firmly in control.
US Dollar Weekly Price Chart: Strong Bullish Trend
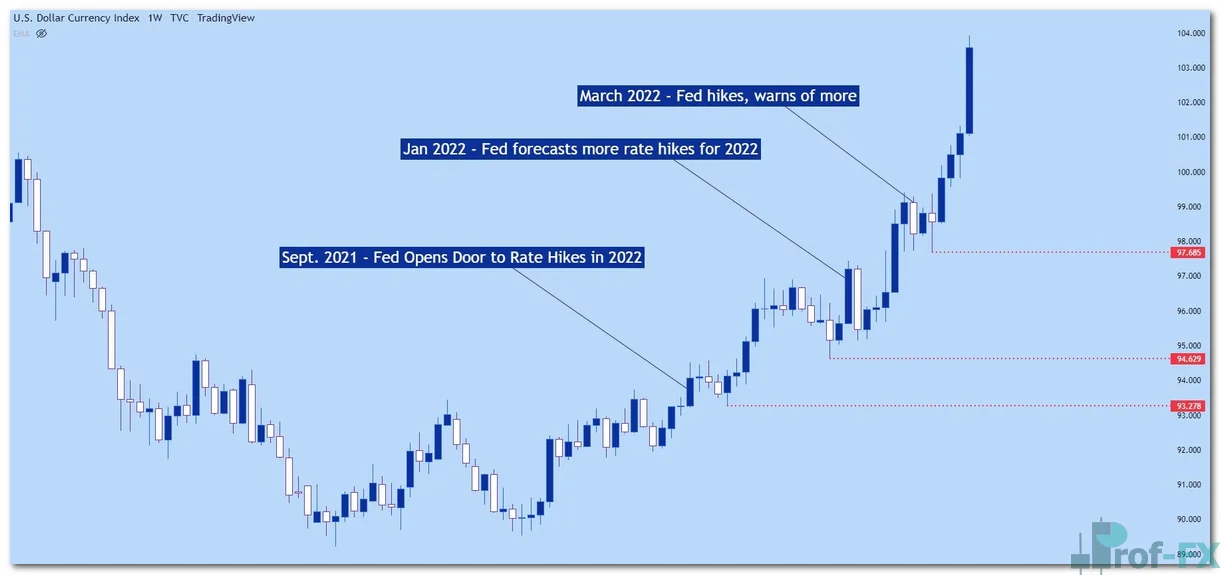
In the chart above, a bullish trend develops as the Federal Reserve signals potential interest rate hikes. This shift in monetary policy creates sustained demand for the US Dollar, driving a sequence of higher-highs.
However, the more critical element for traders is not the highs, but the higher-lows (highlighted by red lines).
The Importance of Pullbacks (Higher-Lows and Lower-Highs)
Pullbacks are where opportunity resides.
While higher-highs confirm trend strength, they often occur after price has already moved significantly. Entering at these points can expose traders to unfavorable risk-reward conditions.
In contrast, higher-lows (in uptrends) and lower-highs (in downtrends) offer:
- More favorable entry prices
- Logical areas for stop loss placement
- Clear invalidation points if the trend fails
This transforms trading from reactive behavior into structured decision-making.
Practical Application in Trading
For traders looking to align with trends:
- Identify the trend structure (higher-highs/higher-lows or vice versa)
- Wait for a pullback rather than chasing price
- Look for confirmation (e.g., wicks, engulfing patterns, support/resistance)
- Enter near the pullback zone
- Place stop loss beyond the recent structure
This approach ensures that trades are based on market behavior rather than speculation.
Key Takeaway
Price action trends are defined by structure, not speed or direction alone. The sequence of highs and lows provides a reliable framework for understanding market behavior.
From a professional standpoint:
- Trends are cyclical and non-linear
- Pullbacks are integral, not disruptive
- Entries should be based on structure, not impulse
Traders who focus on higher-lows in uptrends and lower-highs in downtrends gain a measurable advantage by aligning with the natural rhythm of the market while maintaining disciplined risk control.


