


When selecting technical analysis tools for charting, traders frequently encounter two of the most widely used indicators: the Simple Moving Average (SMA) and the Exponential Moving Average (EMA). Both serve the essential purpose of helping traders interpret price behavior and refine entry and exit decisions. However, despite their similarities, each indicator has distinct characteristics that influence how it responds to market conditions. This section provides a structured comparison of SMA vs EMA to clarify their practical applications.
Simple vs Exponential Moving Average: An Overview
A Simple Moving Average (SMA) is calculated by taking the average price of an asset or currency pair over a specified number of periods. In this calculation, each candlestick’s closing price is assigned equal weight. This means that no single data point has greater influence than another, resulting in a smooth and stable representation of price trends.
In contrast, the Exponential Moving Average (EMA) applies greater weighting to the most recent price data. As a result, it reacts more quickly to current market movements and recent trading activity. While this increased responsiveness may appear advantageous, it introduces an important trade-off. Indicators that react faster are inherently more sensitive to short-term fluctuations, which can increase the likelihood of generating false or misleading entry signals.
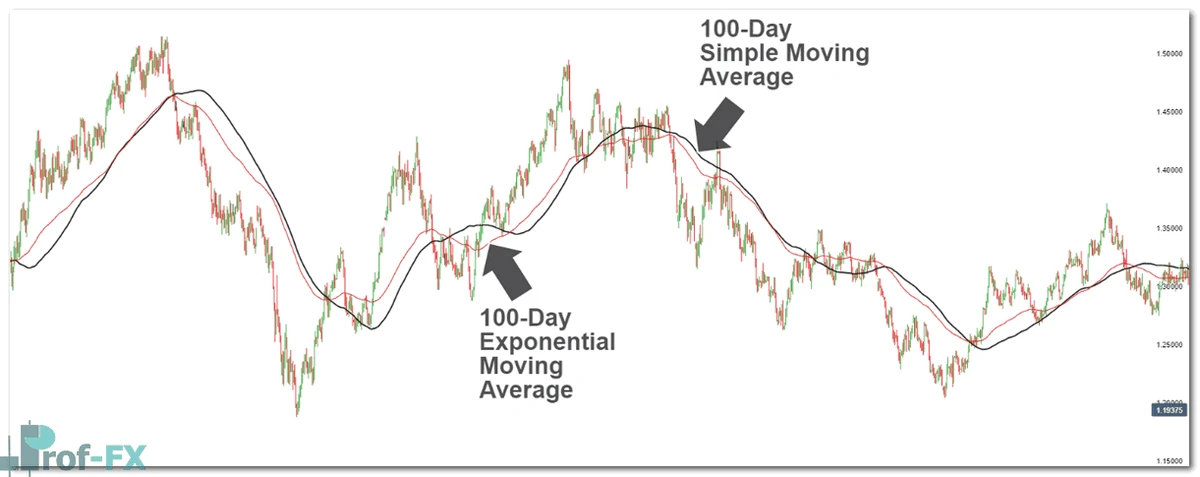
For this reason, many professional traders and large institutions, including banks and hedge funds often rely on SMAs for broader trend analysis, as they provide a more stable and less reactive view of the market. To better understand how these differences manifest visually, consider the daily EUR/USD chart below.
Simple vs Exponential Moving Average: Which is Better?
When directly comparing SMA and EMA, the differences may initially appear minimal, particularly on higher timeframes or during stable market conditions. As illustrated in the chart above, both indicators tend to move closely together, with only slight variations. Typically, the EMA will adjust more quickly than the SMA due to its emphasis on recent price action, but in many cases, the divergence between the two remains relatively small.
However, the distinction becomes more pronounced under specific conditions. In shorter timeframes or during periods of heightened volatility and rapid price movement, the EMA’s sensitivity allows it to respond more quickly, resulting in clearer differences between the two averages. Consequently, short-term traders often prefer the EMA, as it aligns more closely with fast-changing market dynamics and can support more responsive trading strategies.
It is common for newer traders to experiment with both SMA and EMA to determine which better suits their trading style. However, it is critical to understand that neither indicator inherently guarantees superior results. The effectiveness of a moving average is ultimately dependent on how it is integrated into a broader trading strategy.
If switching from an SMA to an EMA appears to transform a losing strategy into a profitable one, this likely indicates that the underlying strategy requires refinement rather than the indicator itself being the decisive factor. The structural differences between SMA and EMA are not significant enough to independently produce such drastic changes in performance.
In practical application, the 200-day SMA is widely regarded as a benchmark for identifying long-term trends. When price remains above the 200-day SMA, the market is generally considered to be in a bullish trend. Conversely, when price falls below this level, it is typically interpreted as a bearish trend.
On the other hand, the 10-day EMA has gained popularity among short-term traders, partly due to its use by well-known market participants. Its responsiveness makes it suitable for capturing shorter-term price movements, although it also requires careful management to avoid reacting to market noise.
Ultimately, the most reliable measure of which moving average to use is consistent trading performance over time. If a particular indicator contributes positively to your results, it justifies its place within your trading system. If not, it should be reassessed or replaced. This disciplined, results-driven approach ensures that indicator selection remains aligned with actual performance rather than preference or assumption.


