


What Is RSI (Relative Strength Index)?
The Relative Strength Index (RSI) is one of the most widely used indicators in technical analysis. As a member of the oscillator family, RSI helps traders assess:
- trend momentum
- market strength
- entry timing
- potential reversals
- overbought and oversold conditions
The RSI was developed by J. Welles Wilder to measure the speed and magnitude of price movements.
It is an oscillator that moves within a fixed range between 0 and 100. One of the most common applications of RSI is identifying overbought and oversold crossover signals, but its functionality extends well beyond that.
To help traders use RSI more effectively, below are three professional yet often overlooked trading tips.
Think Beyond the Crossovers
When traders first learn how to use RSI, they often focus exclusively on overbought and oversold signals.
The standard interpretation is:
- above 70 = overbought
- below 30 = oversold
Many traders wait for RSI to leave one of these zones and use that crossover as a direct trade signal.
While this approach can work during retracement-based market conditions, it often becomes counterproductive in strong trending environments.
RSI is fundamentally a momentum oscillator.
This means that in strong bullish or bearish trends, RSI can remain in overbought or oversold territory for extended periods.
As a result:
- short signals may appear during a strong uptrend
- long signals may appear during a strong downtrend
This is where inexperienced traders often make costly mistakes.
For example, on the EUR/USD 8-hour chart, an initial sell signal may align well with bearish price action.
However, once the bearish trend fully develops, RSI may begin producing multiple bullish crossover signals even while price continues moving lower.
EUR/USD Eight-Hour Price Chart, RSI Applied
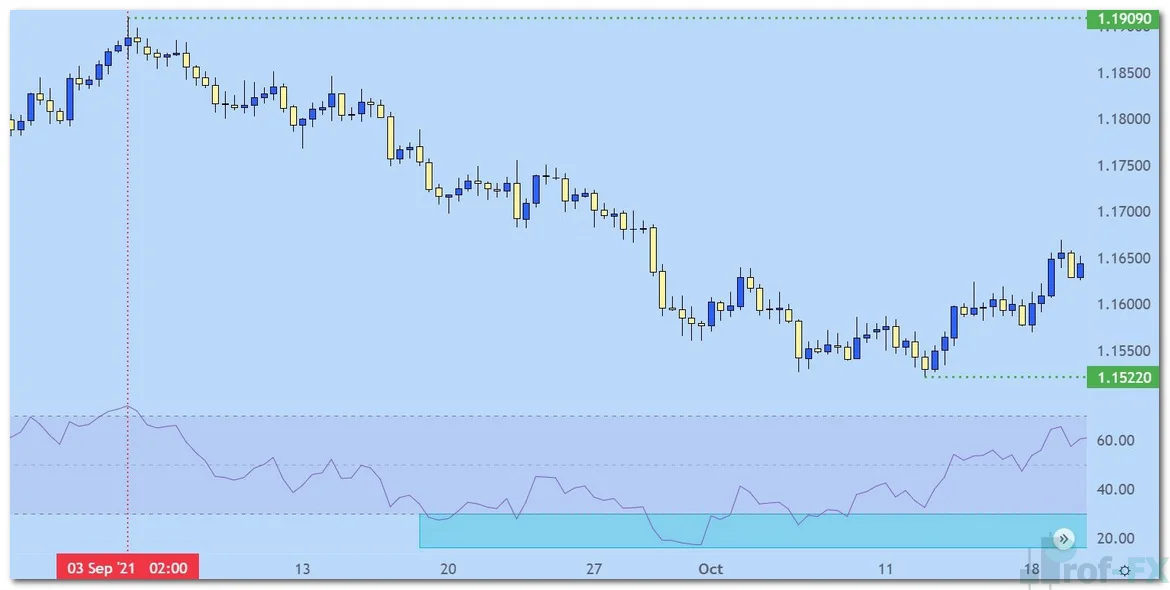
This is precisely why traders should avoid taking RSI signals blindly. RSI is a tool, not a standalone trading system. Like any professional trading tool, it can be highly effective when applied correctly, but if misused, it can lead to repeated losses.
The authoritative takeaway here is simple:
never use RSI crossovers without market context and trend confirmation.
RSI as a Trend Filter – Watch the Center Line
One of the most underutilized RSI features is the centerline at 50.
Every oscillator has a midpoint, and in RSI this centerline plays a critical role in identifying trend bias and momentum shifts.
For RSI:
- above 50 = bullish momentum
- below 50 = bearish momentum
Professional traders often use this level as a trend filter.
If RSI remains above 50, the market is generally considered to have upward momentum, and traders can prioritize long opportunities.
If RSI falls below 50, this often signals the development of a bearish trend, making short setups more favorable.
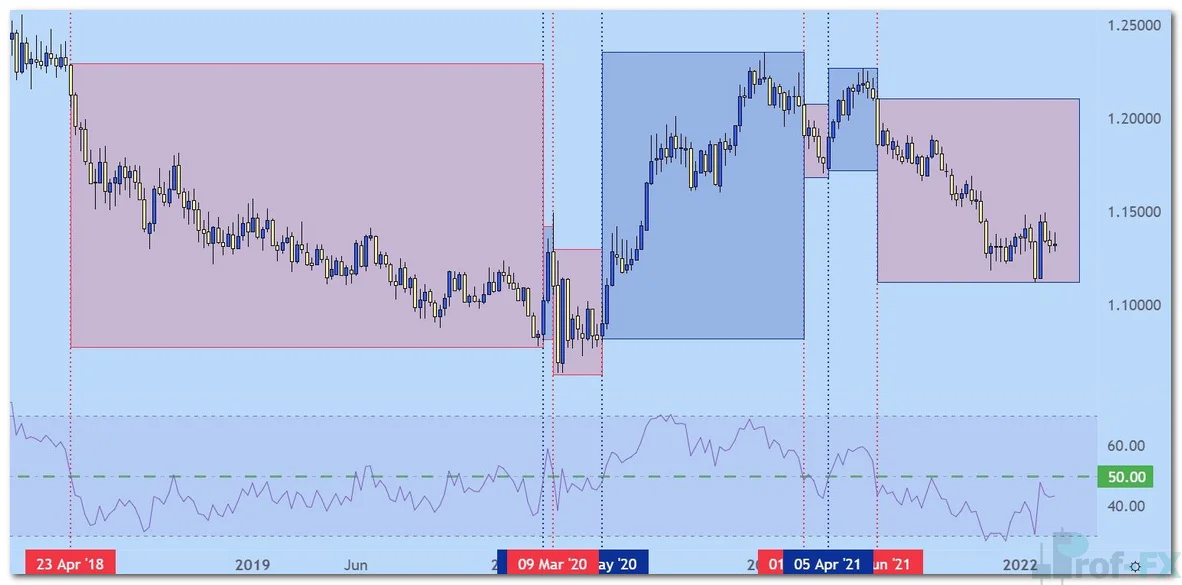
In the EUR/USD weekly chart example, notice how RSI moving above or below the 50 line closely reflected the prevailing market trend.
From April 2018, RSI spent the majority of the time below 50, which aligned with a sustained bearish trend in EUR/USD.
Later, during the Covid-driven market shift in Q1 2020, RSI moved back above 50.
This bullish signal in May 2020 accurately coincided with a strong upward move that lasted for several months.
EUR/USD Weekly Price Chart with RSI Applied
Although no indicator is perfect, using the weekly RSI centerline as a directional bias filter can significantly improve trade selection.
This becomes especially powerful when combined with multiple time-frame analysis, where the higher time frame provides the bias and lower time frames are used for entries.
In professional trading, this method often produces far more reliable signals than using 70/30 crossovers alone.
Check Your Parameters
Like many oscillators, RSI is commonly set to its default 14-period setting.
This means the indicator calculates momentum using the last 14 candles or bars on the chart being viewed.
While 14 is the standard setting, it is not automatically the best setting for every trading style.
Different time horizons require different sensitivity levels.
Short-Term Traders
Short-term traders often use a smaller period, such as 9-period RSI, to capture faster and more responsive price movements.
This makes the indicator more sensitive and increases oscillation.
Longer-Term Traders
Longer-term traders may prefer a 25-period RSI, which smooths the indicator and reduces noise.
This provides more stable momentum signals and is often better suited for swing trading or trend-following strategies.
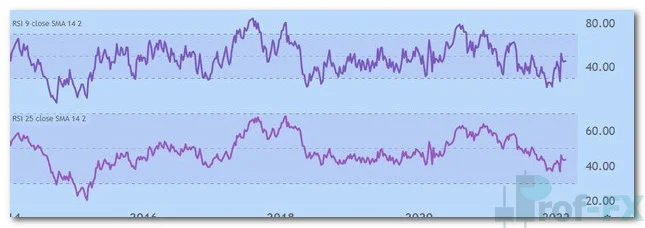
In the comparison below, notice how the 9-period RSI oscillates much more aggressively than the 25-period RSI.
This difference becomes especially visible around:
- the 50 centerline
- the 70 overbought zone
- the 30 oversold zone
The shorter setting reacts faster, while the longer setting offers more confirmation and less noise.
The key professional principle is:
match RSI sensitivity to your trading timeframe and strategy objective.
There is no single universal setting.
Relative Strength Index (RSI) FAQs
What Other Tools Work Well with RSI?
As the name suggests, RSI measures the relative strength of the underlying market.
When using RSI to identify potential reversals, it is highly recommended to combine it with other technical tools such as:
- candlestick analysis
- trendline analysis
- support and resistance
- divergence confirmation
- price action signals
For example, if price forms a bullish reversal candlestick pattern near a support trendline while RSI shows divergence, this creates a much stronger technical signal.
This multi-confirmation approach significantly improves reliability.
What Markets Can RSI Be Applied To?
Because RSI measures momentum and relative strength, it can be applied to nearly any financial market.
It is most commonly used in highly liquid markets such as:
- forex
- stocks
- commodities
- indices
- cryptocurrency
Its versatility makes it one of the most valuable technical indicators for both beginner and professional traders.
The most authoritative use of RSI is not as a standalone trigger, but as a momentum confirmation tool within a broader trading framework.


