The Relative Strength Index (RSI) is one of the most widely used technical indicators in forex and financial markets. Its popularity comes from its simplicity, flexibility, and ability to help traders identify momentum, trend direction, and potential reversal points.
In this guide, I will explain what RSI is, how it is calculated, what it tells traders about market conditions, and how it can be applied in real trading scenarios. This explanation is presented as if I were guiding new traders through one of the foundational tools of technical analysis.
Relative Strength Index (RSI): Key Talking Points
In this article, we will cover:
- What the Relative Strength Index (RSI) is
- How the RSI calculation works
- What information RSI provides about market momentum
- Practical RSI trading examples
- A concise summary of RSI usage for traders
What Is the Relative Strength Index (RSI)?
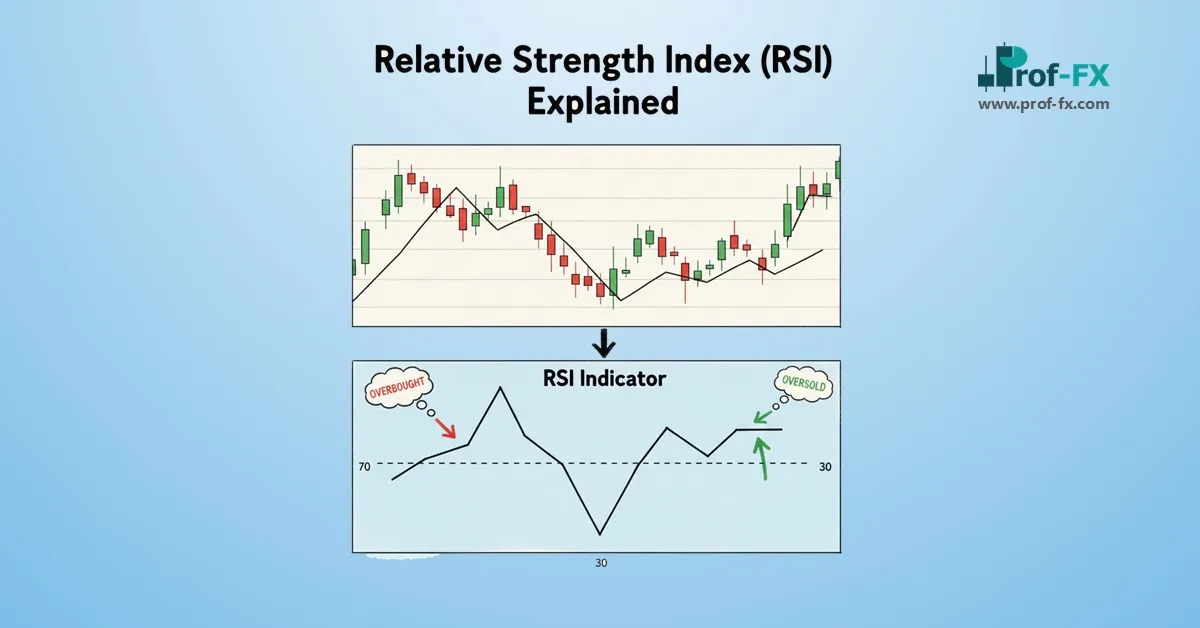
The Relative Strength Index (RSI) is a momentum oscillator used in technical analysis to measure the speed and magnitude of recent price movements. Its primary function is to help traders identify overbought and oversold market conditions.
RSI oscillates between 0 and 100, making it easy to interpret visually on a price chart. Because RSI focuses on momentum rather than price alone, it often provides early insight into potential trend shifts or exhaustion points.
A key feature of the RSI is the mid-line at the 50 level:
- When RSI is above 50, momentum is generally considered bullish
- When RSI is below 50, momentum is typically viewed as bearish
Traders often expand on this concept:
- RSI above 70 suggests the market may be overbought
- RSI below 30 suggests the market may be oversold
These zones do not guarantee reversals, but they act as warning signals that momentum may be stretched.

RSI indicator showing overbought, oversold, and mid-line levels
How Is the Relative Strength Index Calculated?
The Relative Strength Index is calculated using the following formula:

The RSI formula compares the average gains to the average losses over a specified number of periods. The most commonly used setting is 14 periods, as originally proposed by its creator.
RSI was developed by J. Welles Wilder, an engineer, mathematician, and trader. While trading stocks and commodities, Wilder noticed that many traders struggled with timing precise entry and exit points. His solution was to create an indicator that quantified market momentum in a standardized way.
RSI evaluates how price changes from one candle to the next over the chosen period. Strong price advances increase the RSI value, while persistent declines reduce it. The result is a dynamic measurement of market strength relative to recent price behavior.
What Does the Relative Strength Index Tell Traders?
RSI can be applied in several practical ways. Below are the most common and effective uses, particularly for forex traders.
Using RSI to Identify Overbought Conditions
When RSI rises above 70, it indicates that price has moved aggressively to the upside and momentum may be overheating. This does not automatically mean price will reverse, but it does suggest that upside risk may be limited in the short term.
USD/ZAR Overbought Example
In the USD/ZAR chart below, RSI moves above the 70 level, signaling a potential overbought condition. Traders often begin watching for price weakness, bearish candlestick patterns, or confirmation from other indicators before considering short positions.
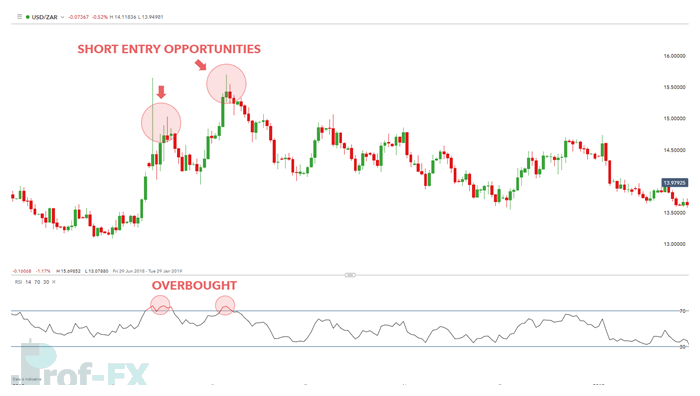
USD/ZAR chart showing RSI overbought signal
Using RSI to Identify Oversold Conditions
When RSI falls below 30, the market may be oversold, meaning selling pressure has been unusually strong. This condition can precede a corrective bounce or a trend reversal, especially if supported by price action.
GBP/USD Oversold Example
In the GBP/USD example below, RSI drops beneath the 30 level, indicating potential oversold conditions. Traders may look for bullish confirmation before entering long positions.
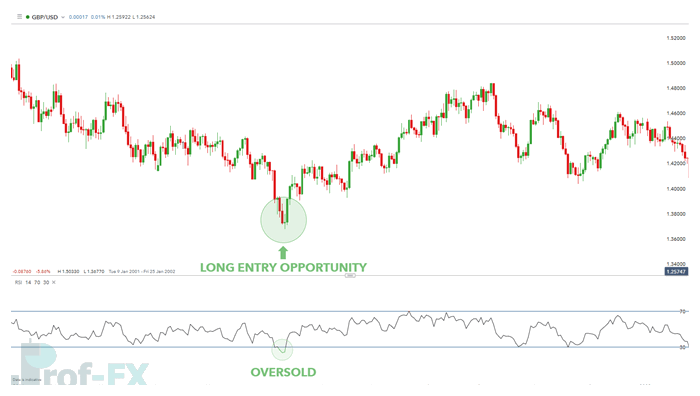
GBP/USD chart showing RSI oversold signal
Using RSI Divergence to Spot Potential Reversals
Beyond overbought and oversold signals, RSI divergence is one of the most valuable applications of this indicator. Divergence occurs when price movement and RSI momentum move in opposite directions, suggesting weakening trend strength.
Positive (Bullish) RSI Divergence
Positive divergence occurs when:
- Price makes lower lows
- RSI makes higher lows
This suggests that bearish momentum is fading and a potential upside reversal may follow.
USD/JPY Positive Divergence Example
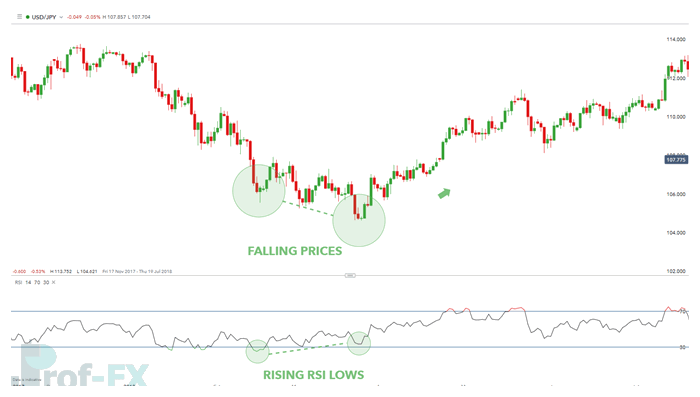
USD/JPY chart showing bullish RSI divergence
Negative (Bearish) RSI Divergence
Negative divergence occurs when:
- Price makes higher highs
- RSI makes lower highs
This signals that bullish momentum is weakening and downside risk may increase.
USD/JPY Negative Divergence Example
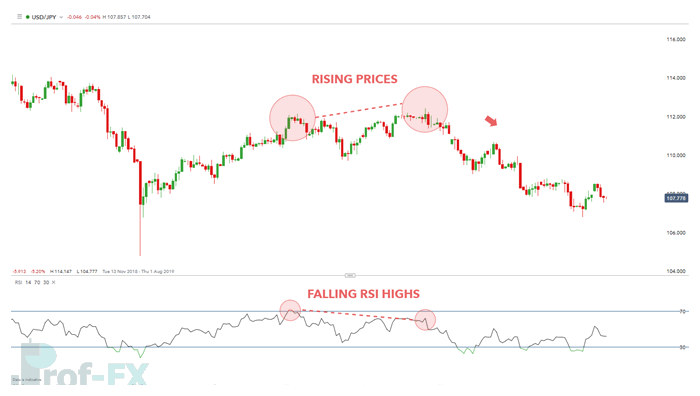
USD/JPY chart showing bearish RSI divergence
Relative Strength Index (RSI): Summary for Traders
The Relative Strength Index measures market momentum, making it one of the most versatile indicators available to traders. Its adaptability allows it to be used across:
- Forex markets
- Stock indices
- Commodities
- Cryptocurrencies
RSI can be applied for:
- Identifying trend direction
- Spotting overbought and oversold conditions
- Detecting potential market reversals through divergence
For novice technical traders, RSI is a foundational indicator that encourages disciplined analysis rather than emotional decision-making. When combined with proper risk management and additional confirmation tools, RSI becomes a powerful component of any trading strategy.
Become a Better Trader with Professional Trading Insights
To deepen your understanding of RSI and technical trading:
- Explore RSI trend trading strategies and real-market examples
- Download a comprehensive forex trading guide for beginners
- Stay informed on macroeconomic events using an economic calendar
- Learn how to apply sound risk management and position sizing
- Read upcoming guides on the Exponential Moving Average (EMA) and 200-day Moving Average
- Discover professional habits in the Traits of Successful Traders guide
Prof FX delivers expert forex news and technical analysis focused on the trends shaping global currency markets.