


Why Price Never Moves in a Straight Line
Any trader who has spent enough time analyzing candlestick charts will quickly recognize one essential truth: financial markets rarely move in a straight, linear fashion.
Even during strong trends, price does not simply rise or fall continuously. Instead, market movement unfolds through a series of price swings, reflecting the ongoing battle between buyers and sellers.
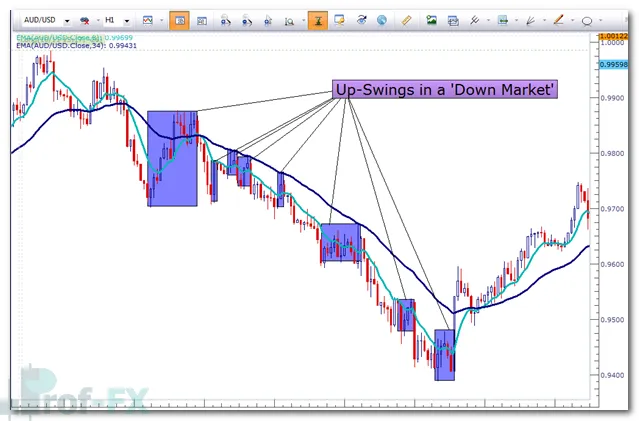
In a downtrend, price declines are often interrupted by temporary upward corrections, commonly referred to as up-swings.
Conversely, in an uptrend, bullish price movement is frequently punctuated by down-swings, as sellers attempt to regain control before buyers reassert dominance.
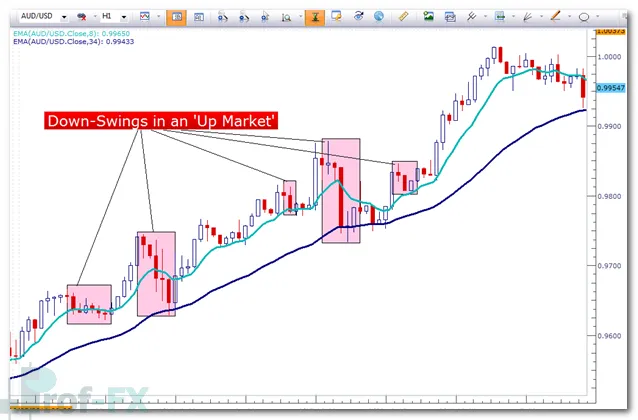
When markets are range-bound, both up-swings and down-swings are clearly visible as price oscillates between support and resistance levels.
Understanding these swings is fundamental for traders who rely on price action, as swings form the building blocks of trends, ranges, and breakouts.
What Are Price Action Swings?
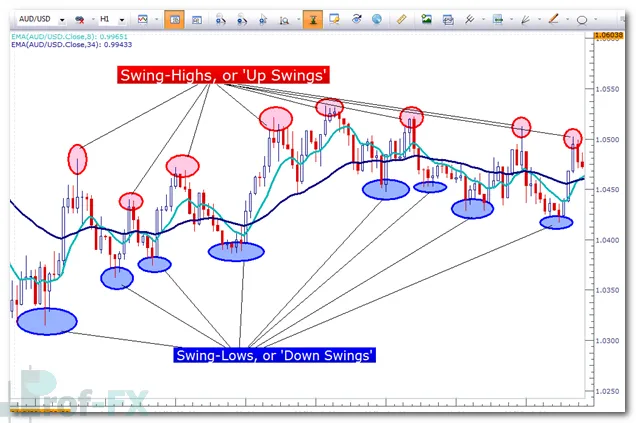
A price action swing represents a visible shift in short-term market direction. These swings reflect temporary exhaustion, profit-taking, or renewed participation by market players.
Swing Lows (Down Swings)
A swing low is formed when price reaches a local low that is:
- Preceded by higher prices
- Followed by higher prices
In other words, price makes a low point that is surrounded by higher lows on both sides, indicating rejection of lower prices.
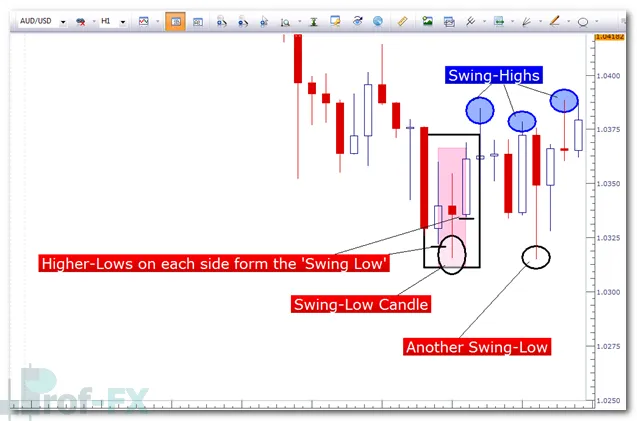
Swing lows are especially important in identifying:
- Uptrends
- Support levels
- Logical areas for risk management
How Swings Help Identify Market Trends
One of the most practical uses of price swings is trend identification.
By observing the sequence of swings, traders can objectively determine market direction:
- Uptrend: Higher highs and higher lows
- Downtrend: Lower highs and lower lows
- Range: Neither structure dominates consistently
This approach removes much of the subjectivity that newer traders often struggle with when identifying trends.
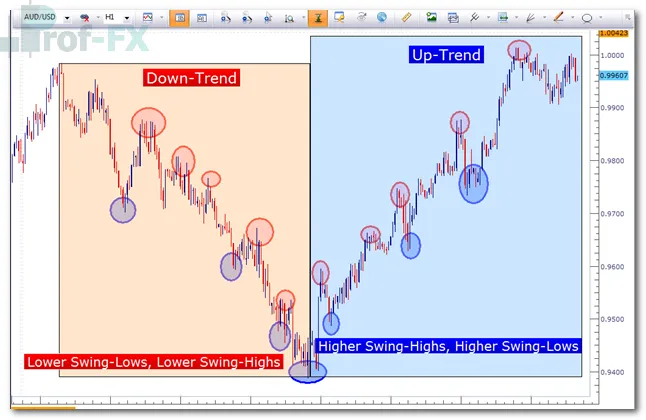
Rather than guessing trend direction, price action traders simply read what the market is printing.
Using Price Swings for Risk Management
Beyond trend identification, price swings are extremely valuable for managing risk.
Consider a trader looking to enter a long position in an uptrend. A logical assumption might be:
“If price breaks below the most recent swing low, then the uptrend may no longer be intact.”
Using this logic, the trader can:
- Enter long in the direction of the trend
- Place a stop-loss below the most recent swing low
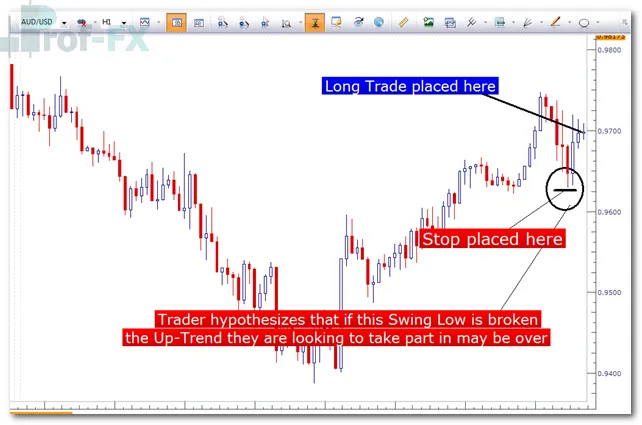
This method aligns stop placement with market structure, rather than arbitrary pip distances, allowing price to fluctuate naturally while protecting against genuine trend failure.
Managing Open Positions Using Swings
Once a trader is already in a position, the same swing-based logic can be applied to trade management.
As price continues to move in favor of the trade:
- New swing lows (in an uptrend) may form
- Traders can trail stops higher
- Risk is reduced while allowing profits to run
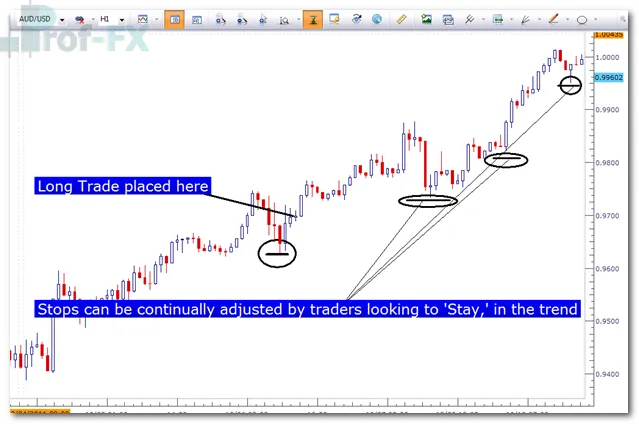
This approach helps traders avoid the common mistake of exiting winning trades too early, while still maintaining disciplined risk control.
Why Price Action Swings Matter
Price action swings are far more than visual patterns on a chart. They reflect:
- Shifts in momentum
- Acceptance or rejection of price levels
- Institutional participation
- Changes in short-term sentiment
By learning to interpret swings correctly, traders gain insight into how the market is behaving, rather than reacting emotionally to every candle.
Looking Ahead: Swings and Breakout Opportunities
In this article, we’ve covered three of the most common and practical uses of price swings:
- Identifying trends
- Placing stops logically
- Managing positions effectively
However, this is only the surface of what price swings can offer. In the next piece, we will explore how traders can use swings to identify breakout opportunities—those moments when price escapes established structure and produces the large directional moves that many traders actively seek.


