


Key Concepts of Reading Candlestick Charts
Candlestick charts differ significantly from traditional bar charts in both structure and usability. In practice, most traders, especially those engaged in day trading, prefer candlestick charts due to their clearer visual representation of price movement.
Understanding the structure of a candlestick is essential. Each component provides critical information about market behavior, enabling traders to integrate candlestick analysis into a structured trading strategy with greater precision.
What Is a Candlestick Chart?
A candlestick chart is a visual representation of price action, composed of individual “candles.” Each candle reflects four key data points within a selected time frame:
- Open price
- Close price
- High price
- Low price
These data points provide insight into market sentiment, trend direction, and potential reversals.
Price action analysis allows traders to identify recurring patterns. Groups of candlesticks can form structures that signal either trend continuation or reversal, while individual candles may indicate specific entry or exit opportunities.
The time frame determines the scope of each candle. For example, on a daily chart, each candle represents one full trading day, including its open, close, high, and low. A candle closing significantly below its open often reflects bearish pressure, suggesting potential continuation to the downside.
Interpreting a Single Candlestick
A standard candlestick consists of three main elements: the body, the wicks (or shadows), and the open/close levels. Together, these define the price movement within a specific period.
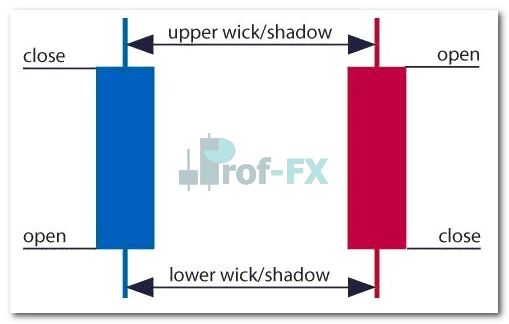
Open Price
The open price represents the first traded price at the start of a candle. If price moves upward after opening, the candle typically appears bullish (commonly green or blue). If price declines, the candle appears bearish (commonly red).
High Price
The high is the highest traded price during the selected period. It is represented by the top of the upper wick. If no upper wick exists, the high is equal to either the open or close price.
Low Price
The low is the lowest traded price during the period, shown at the bottom of the lower wick. If no lower wick exists, the low coincides with either the open or close price in a bullish or bearish structure.
Close Price
The close price is the final traded price of the candle. A close above the open indicates bullish momentum, while a close below the open reflects bearish pressure.
The Wick (Shadow)
Wicks represent the extremes of price movement within the period. Their length provides insight into volatility and rejection levels. Long wicks often signal strong buying or selling pressure at certain price levels, making them highly valuable for price action analysis.
Direction
The direction of a candlestick is determined by the relationship between the open and close:
- Close above open → bullish (upward movement)
- Close below open → bearish (downward movement)
Range
The range of a candle is the difference between its high and low:
Range = High − Low
This measurement reflects the total price movement during the selected time frame and provides insight into volatility.
A comprehensive understanding of these components enables traders to interpret trendlines, price patterns, and even advanced structures such as Elliott Waves with greater accuracy.
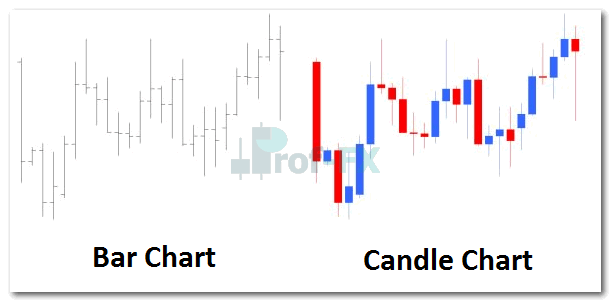
Candlestick Chart vs Bar Chart
Compared to bar charts, candlestick charts offer superior visual clarity. Bar charts display the same price data but lack intuitive visual cues, making it more difficult to identify direction, momentum, and patterns.
Candlestick charts, by contrast, simplify decision-making by clearly illustrating bullish and bearish sentiment, as well as recognizable formations.
How to Effectively Read Candlestick Charts
Reading candlestick charts depends on your trading strategy and selected time frame. Some traders focus on individual candle formations, while others prioritize multi-candle patterns or broader price structures.
A disciplined approach requires aligning candlestick analysis with a defined methodology.
Interpreting Single-Candle Formations
Individual candlesticks can reveal shifts in market sentiment. Common formations include:
- Hammer
- Shooting Star
- Hanging Man
These formations often indicate potential reversals or momentum changes.
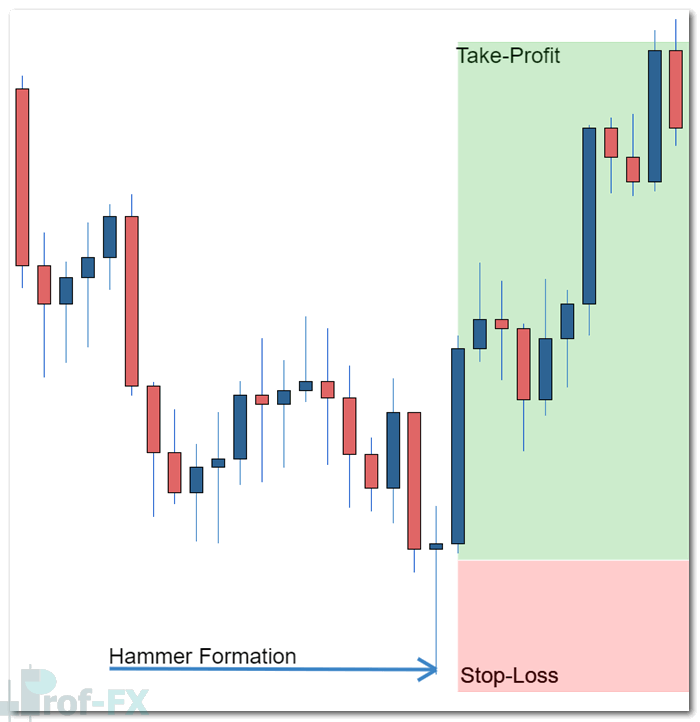
For example, the Hammer pattern is characterized by:
- A small body
- A long lower wick
- A close above the open (bullish bias)
This structure suggests that sellers initially pushed prices lower, but buyers regained control and drove prices upward before the close.
From a strategic standpoint, this reflects buying pressure and may signal a bullish reversal. Traders often enter long positions after confirmation (i.e., candle close), place a stop loss below the wick, and set a take profit that maintains a favorable risk/reward ratio.
Identifying Multi-Candle Price Patterns
Beyond single candles, multiple candlesticks can form patterns that provide stronger signals. Examples include:
- Bullish engulfing pattern
- Bearish engulfing pattern
- Triangle formations
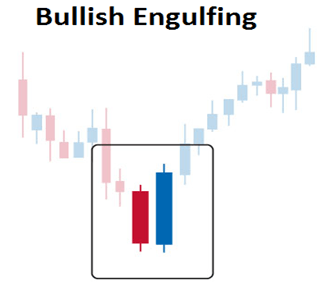
The bullish engulfing pattern consists of:
- A bearish candle followed by a larger bullish candle
- The second candle fully “engulfs” the first
This pattern indicates a shift from selling pressure to buying dominance, often signaling the end of a downtrend.
A disciplined execution approach involves:
- Entering a long position after the engulfing candle closes
- Placing a stop loss below the pattern
- Setting a take profit aligned with a positive risk/reward ratio
It is critical to note that the pattern is only valid after the second candle has fully formed.
Advanced Tips for Reading Candlestick Charts
To maximize the effectiveness of candlestick analysis, traders must consistently consider:
- Time frames: Align analysis with your trading horizon (intraday, swing, or position trading)
- Price patterns: Combine candlestick signals with support, resistance, and trend structures
- Price action: Focus on how price behaves rather than relying solely on indicators
Professional Perspective
Candlestick charts are not merely visual tools, they are a structured framework for interpreting market psychology. When used correctly, they provide actionable insights into momentum, volatility, and potential turning points.
However, their effectiveness depends entirely on disciplined application within a broader trading plan. Traders who integrate candlestick analysis with risk management, defined setups, and consistent execution gain a measurable edge in the forex market.
In professional trading, candlestick charts are not optional, they are a core component of price action analysis and decision-making.


