Trading Breakouts and Pullbacks
This section examines two foundational trading strategies in forex: pullback trading and breakout trading. Each approach is grounded in price action principles and offers distinct advantages depending on market structure and volatility conditions. Understanding when and how to apply these strategies is essential for identifying high-probability trading opportunities.
The Pullback Trade
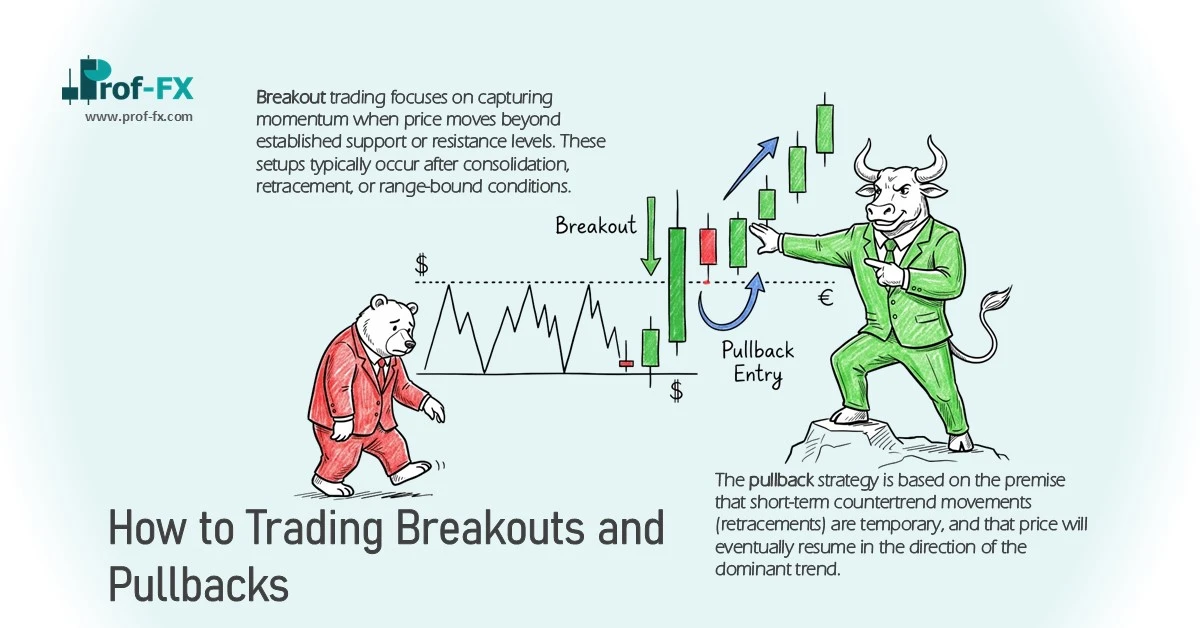
The pullback strategy is based on the premise that short-term countertrend movements (retracements) are temporary, and that price will eventually resume in the direction of the dominant trend.
A particularly high-quality setup is the post-breakout pullback, the first retracement following a breakout. This scenario often signals the early stages of a developing trend, providing an opportunity to enter at a favorable price before momentum accelerates.
When to Enter
Effective pullback entries depend on two primary factors:
1. Support and Resistance
The presence of support or resistance is critical. These levels represent areas where demand (support) or supply (resistance) is actively influencing price.
- In an uptrend, price should retrace toward support before continuing higher
- In a downtrend, price should pull back toward resistance before resuming lower
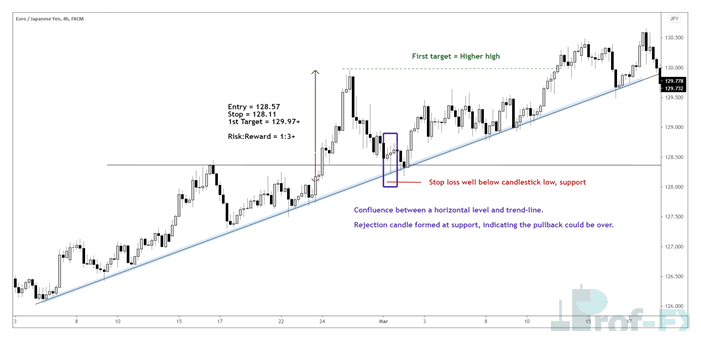
The strongest setups occur when there is confluence, meaning multiple technical factors align at the same level. This may include:
- Horizontal price levels
- Trendlines or slopes
- Fibonacci retracement levels
- Moving averages
Confluence significantly increases the reliability of the level.
2. Price Action Confirmation
Once price reaches a key level, market reaction must confirm the setup. This is best evaluated through candlestick analysis.
High-quality signals include:
- Reversal candles with long wicks and small bodies (e.g., bullish hammer, bearish shooting star)
- Strong patterns such as bullish engulfing or bearish engulfing candles
These formations indicate rejection of price and signal that market participants are likely to push price back in the direction of the trend.
Risk Management
Risk management must align with the technical structure of the trade:
- Stop loss placement:
- Below support for long positions
- Above resistance for short positions
Stops should be positioned beyond key levels to avoid being triggered by minor price fluctuations.
- Take profit targets:
- For long trades → near resistance levels
- For short trades → near support levels
The relationship between entry, stop loss, and target defines the risk/reward ratio, which should ideally be 1:2 or better.
For example:
- Entry: 100
- Stop loss: 99
- Target: 102
→ Risk/Reward = 1:2
This ensures that potential returns justify the risk taken.
Example of Pullback Trade
The Breakout Trade
Breakout trading focuses on capturing momentum when price moves beyond established support or resistance levels. These setups typically occur after consolidation, retracement, or range-bound conditions.
Breakouts can develop in two primary contexts:
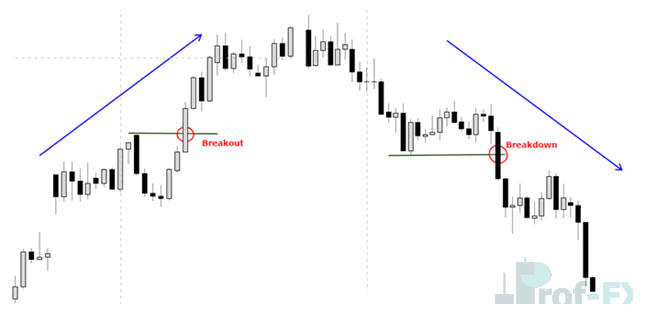
- Trend breakout: A continuation pattern where price breaks above a previous swing high (bullish) or below a swing low (bearish)
- Range breakout: Occurs when price exits a horizontal range, signaling potential trend initiation
Additionally, breakouts often emerge from chart patterns such as:
- Triangles and wedges
- Rectangles
- Flags and pennants
- Head and shoulders formations
Price Breakouts (Bullish & Bearish)
When to Enter
There are several execution methods for breakout trades:
- Immediate entry: Enter as soon as price breaks the level
- Confirmation entry: Wait for a candle to close beyond the level
- Hybrid approach: Combine both methods
The confirmation method provides higher reliability by reducing false breakouts, but may result in missed opportunities during strong moves.
A balanced strategy is to split position size:
- Enter 50% at the initial breakout
- Enter 50% after a confirmed close beyond the level
This approach reduces risk if the breakout fails while still allowing full participation if the breakout is validated.
Risk Management
Breakout trades require careful structuring of risk parameters:
- Stop loss placement:
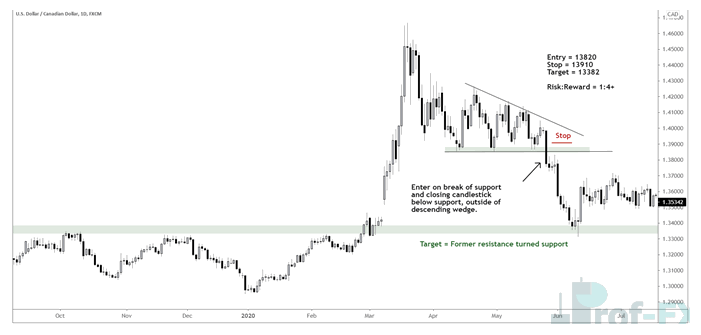
- For long trades → below the breakout level (former resistance)
- For short trades → above the breakout level (former support)
Stops must allow sufficient room to account for volatility while remaining logically aligned with the setup.
- Take profit targets:
- Determined using technical analysis (e.g., next support/resistance levels or measured moves)
A favorable risk/reward ratio (minimum 1:2) remains essential.
For pattern-based breakouts, due to their subjective nature, it is generally more prudent to wait for a confirmed closing candle outside the pattern before entering. This reduces the likelihood of false signals.
Example of a Breakout Trade
Conclusion
Both pullback and breakout strategies are essential components of a comprehensive trading approach. Pullbacks offer precision entries within established trends, while breakouts provide opportunities to capture strong momentum and emerging trends.
The effectiveness of each strategy depends on market conditions, but in both cases, success is determined by:
- Proper identification of support and resistance
- Clear price action confirmation
- Strict and consistent risk management
A disciplined application of these principles enables traders to operate with structure, consistency, and a measurable edge in the forex market.