


The Head and Shoulders pattern is widely regarded as one of the most reliable and well-structured trend reversal patterns in technical analysis. It is used extensively by professional traders across forex, stock indices, commodities, and equities, largely because it offers clear visual structure, defined risk levels, and measurable profit targets.
Both novice and experienced traders value this pattern for its ability to signal when a prevailing trend is losing momentum and a reversal is likely to occur. Its inverse counterpart—the Inverse Head and Shoulders pattern—is equally important and follows the same analytical logic in the opposite market condition.
This guide explains how the Head and Shoulders pattern works, how to identify it correctly, and how traders can apply it consistently across different markets.
Head and Shoulders Chart Pattern: Key Topics Covered
- What is the Head and Shoulders pattern?
- What is the Inverse Head and Shoulders pattern?
- How to identify Head and Shoulders patterns on forex and stock charts
- How to trade the Head and Shoulders pattern step by step
- Advantages and limitations of the Head and Shoulders pattern
What Is the Head and Shoulders Pattern?
The Head and Shoulders pattern is a bearish reversal formation that appears after a sustained uptrend, signaling that bullish momentum is weakening and a potential trend reversal to the downside is developing.
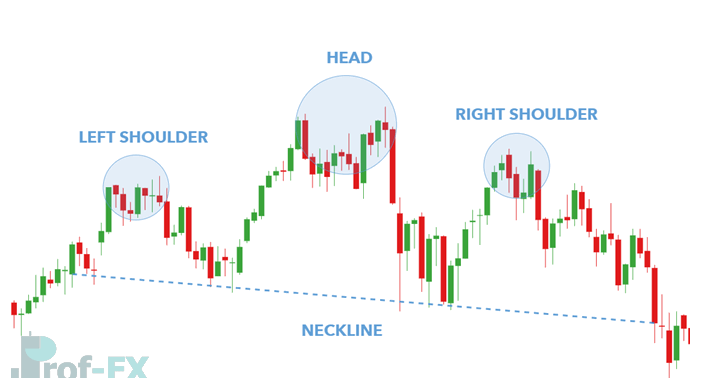
Visually, the pattern resembles a human head and shoulders and consists of four main components:
- Left Shoulder: Price makes a high and then pulls back
- Head: Price rallies to a higher high, then declines again
- Right Shoulder: Price attempts another rally but fails to reach the height of the head
- Neckline: A support level drawn by connecting the lows between the shoulders and the head
Once price breaks below the neckline, the pattern is considered confirmed.
From a market psychology perspective, this structure reflects a gradual shift from bullish dominance to seller control, as buyers are no longer able to push prices to new highs.
What Is the Inverse Head and Shoulders Pattern?
The Inverse Head and Shoulders pattern is the bullish counterpart of the standard formation. It appears after a downtrend and signals a potential trend reversal to the upside.
The structure is identical in principle but inverted:
- Price forms a left shoulder low
- Drops further to form a deeper head
- Rises and then forms a higher right shoulder
- A neckline connects the highs between these lows
A confirmed break above the neckline indicates strengthening bullish momentum and a possible trend reversal.

The inverse pattern highlights the transition from selling pressure to buying strength as the market begins to establish higher lows.
How to Identify Head and Shoulders Patterns on Forex and Stock Charts
The identification process is identical across forex, stocks, indices, and commodities, making this pattern highly versatile.
Step-by-Step Identification Checklist
- Identify a clear preceding trend
- Uptrend for standard Head and Shoulders
- Downtrend for Inverse Head and Shoulders
- Locate the three key peaks or troughs
- The head should be clearly higher (or lower in inverse) than both shoulders
- Ensure the distance between the head and each shoulder is relatively balanced
- Draw the neckline across the swing lows (or highs for inverse)
- A horizontal neckline is ideal but not required
- Look for decreasing momentum
- Oscillators such as RSI or MACD often show divergence near the head
This disciplined identification process helps traders avoid forcing patterns where none truly exist.
How to Trade the Head and Shoulders Pattern
Once the pattern is clearly identified, traders can plan entries, stop losses, and profit targets in a structured and rule-based manner.
Trading Stocks Using the Head and Shoulders Pattern

The chart above illustrates a Head and Shoulders pattern on the Germany 30 (DAX 30) index.
Trade Execution Logic:
- Entry:
- Conservative traders wait for a confirmed candle close below the neckline
- Aggressive traders may enter on a price break below the neckline, accepting higher risk
- Conservative traders wait for a confirmed candle close below the neckline
- Stop Loss:
- Placed above the right shoulder high
- Placed above the right shoulder high
- Take Profit:
- Measured by calculating the vertical distance from the head to the neckline
- This distance is projected downward from the neckline break
- Measured by calculating the vertical distance from the head to the neckline
Some traders apply a two-candle confirmation rule, requiring two consecutive closes below the neckline to reduce false breakouts—though this may reduce overall reward potential.
In this example, the trade maintains a risk-reward ratio near 1:1.2, which remains acceptable within professional risk management guidelines.
Trading Forex Using the Inverse Head and Shoulders Pattern

The USD/ZAR forex pair demonstrates a common characteristic of real-world patterns: asymmetry. Perfect symmetry is rare, especially in volatile currency pairs.
Trade Execution Logic:
- Entry:
- Triggered by a break and close above the neckline
- Triggered by a break and close above the neckline
- Stop Loss:
- Placed below the right shoulder low
- Placed below the right shoulder low
- Take Profit:
- Measured from the head low to the neckline, projected upward
Despite a slightly slanted neckline, the pattern remains valid as long as structural integrity is preserved.
Advantages and Limitations of the Head and Shoulders Pattern
Advantages
- Clearly defined structure for trend reversal analysis
- Offers precise stop-loss and take-profit levels
- Applicable across all markets and time frames
- Effective when combined with momentum indicators
- Capable of capturing large directional moves
Limitations
- Difficult for beginners to identify correctly
- False breakouts may occur near the neckline
- Confirmation candles may increase stop-loss distance
- Risk-reward ratios are not always optimal
- Price often retests the neckline, causing hesitation for new traders
Understanding both strengths and weaknesses allows traders to apply the pattern with realistic expectations.
Final Thoughts on the Head and Shoulders Pattern
The Head and Shoulders pattern remains one of the most respected reversal patterns in technical trading due to its logical structure, market psychology foundation, and risk-defined framework.
When combined with:
- Trend confirmation
- Momentum indicators
- Sound risk management
this pattern becomes a powerful tool for traders seeking consistency rather than prediction.
Further Reading on Forex Trading Patterns
- Master the basics with How to Read a Candlestick Chart
- Learn additional reversal signals with Doji Candlestick Patterns
- Explore different forex trading styles and strategies
- If you’re new, start with our New to Forex Trading Guide


