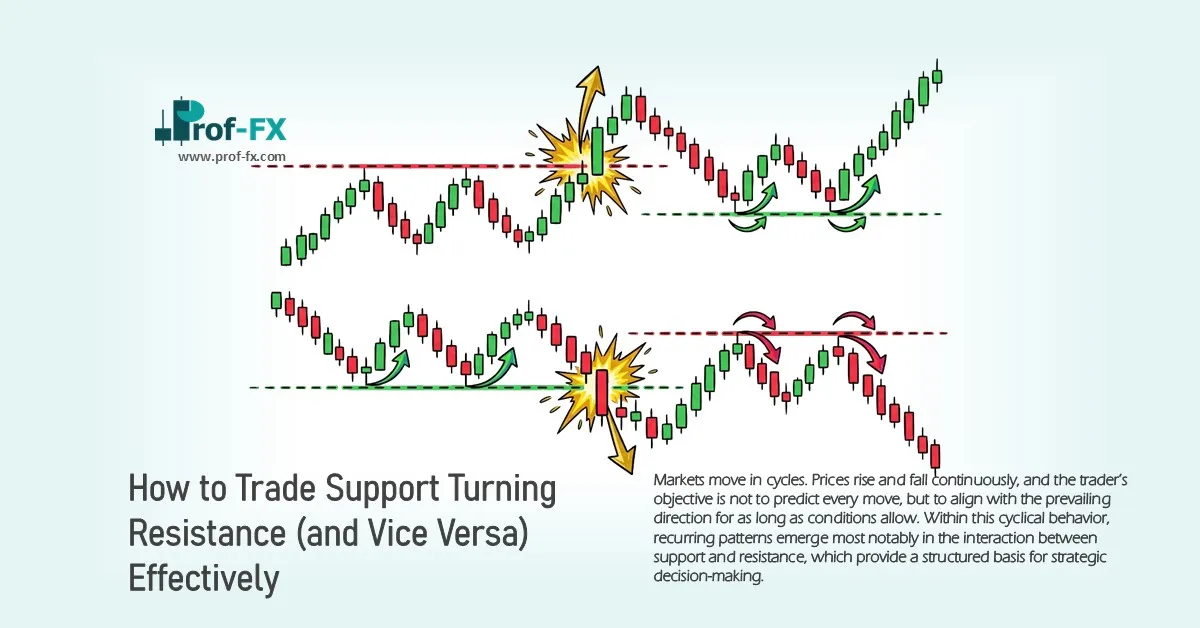
Markets move in cycles. Prices rise and fall continuously, and the trader’s objective is not to predict every move, but to align with the prevailing direction for as long as conditions allow. Within this cyclical behavior, recurring patterns emerge most notably in the interaction between support and resistance, which provide a structured basis for strategic decision-making.
In trending environments, price action tends to follow identifiable sequences. A bullish trend is typically characterized by higher-highs and higher-lows, while a bearish trend forms lower-highs and lower-lows. However, markets do not trend indefinitely. Periods of consolidation or range-bound movement frequently occur when price equilibrium is reached. These conditions often give rise to formations such as inside bars, which reflect temporary indecision.
Price Action Support and Resistance
There are numerous methods for identifying support and resistance levels. Tools such as Fibonacci retracement and psychological price levels are widely used. However, their effectiveness depends entirely on whether the market acknowledges these levels. If price does not react to a level, it holds no practical value.
Therefore, the true function of support and resistance is not prediction, but preparation. These levels allow traders to define potential reaction zones and operate within a structured, objective framework. Price action, in particular, offers a direct and reliable way to identify such levels based on actual market behavior.
Beyond standard identification techniques, historical price levels especially those previously tested, can regain significance over time. This introduces one of the most important principles in price action trading: former resistance can become support, and former support can become resistance.
Support from Prior Resistance and Resistance from Prior Support
In an uptrend, price movements typically oscillate with a directional bias upward. During pullbacks, traders look for areas where buying interest may re-emerge. One of the most reliable reference points is prior resistance, specifically previous swing-highs that may now act as support.
Conversely, in a downtrend, prior swing-lows or support levels often transform into resistance zones where selling pressure may re-enter the market.
GBP/USD Weekly Price Chart
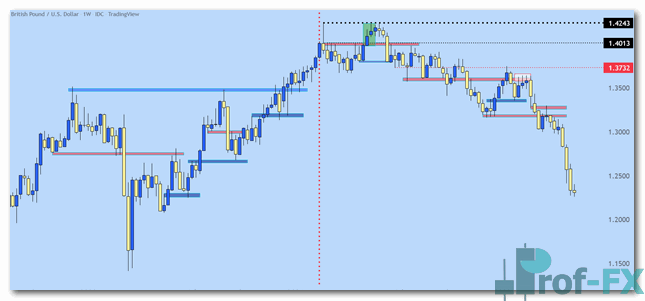
In the chart above, blue lines represent prior resistance levels that later acted as support, while red lines indicate former support levels that transitioned into resistance. This illustrates the cyclical and adaptive nature of price action.
Detailed Price Development Analysis
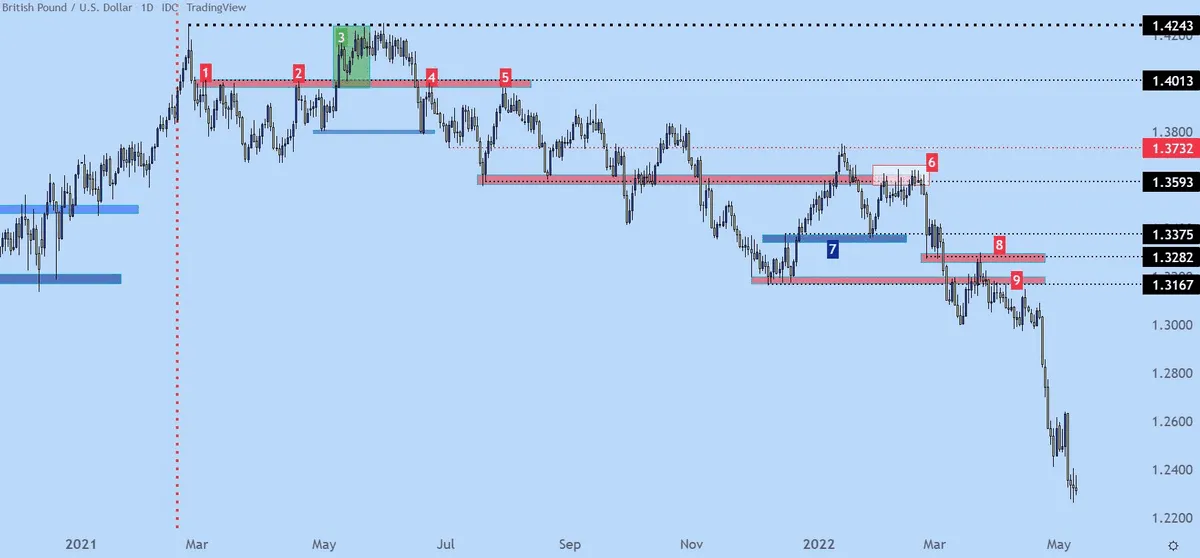
To examine this behavior more closely, consider the following sequence on the daily chart:
The analysis begins at the red vertical line, where price establishes a swing high near 1.4013 (point ‘1’). Multiple wick rejections around this level highlighted in the red box, indicate strong resistance, persisting from early March through early May (point ‘2’).
Eventually, buyers gain enough momentum to break above this resistance zone, as shown in the green box (point ‘3’). This breakout confirms a shift in control, but the upward move encounters a new barrier at 1.4243, a level that had previously influenced price action.
Failure to break above this level leads to a reversal, with sellers pushing price back below 1.4013. The market then declines toward the 1.3800 area (purple box), where support triggers a rebound. This bounce brings price back toward the previous resistance zone (point ‘4’), reinforcing its relevance.
GBP/USD Daily Price Chart
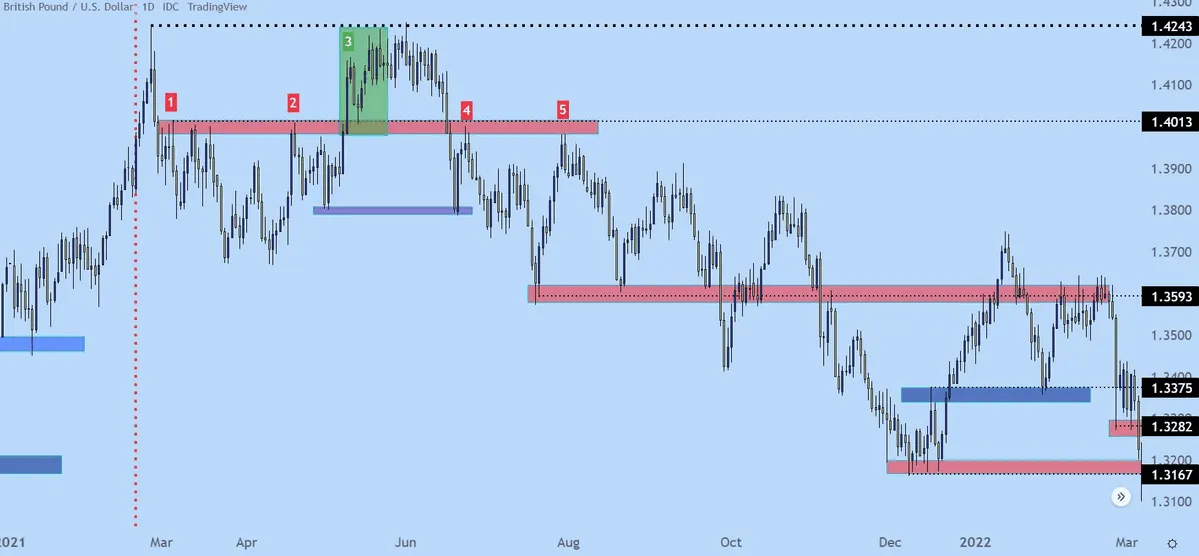
Following this rejection, price forms a new low near 1.3600. However, the market does not immediately enter a strong bearish trend. Instead, it attempts another upward move but fails to reach the previous high, forming a lower-high. This behavior signals weakening bullish momentum and increasing seller participation.
Sellers begin entering positions earlier, anticipating resistance before it is fully tested. This results in a series of lower-highs and more aggressive downward pressure (point ‘5’).
Continuation and Confirmation of Bearish Bias
After the second resistance reaction, price declines again toward support, which initially holds. However, over time, this support eventually breaks, confirming a broader bearish shift.
In early 2022, the 1.3600 level previously a support zone, emerges as a strong resistance area. This transition takes several months to fully develop, but the pattern of lower-highs consistently signals bearish control.
A particularly notable reaction occurs in the white box (point ‘6’), where resistance holds firmly for nearly three weeks before triggering a sustained sell-off. This reinforces the principle that repeated tests of a level strengthen its significance.
As the downtrend progresses:
- Former resistance levels act as support (point ‘7’)
- Previous support levels become resistance (point ‘8’)
Additionally, the continued formation of lower-highs beneath prior resistance zones (highlighted in box ‘9’) further confirms persistent selling pressure.
GBP/USD Daily Price Chart
Key Takeaway
The transformation of support into resistance and resistance into support, is not coincidental. It reflects underlying shifts in market sentiment and order flow. Traders who recognize and apply this principle gain a clear structural advantage.
From a professional standpoint, these role reversals should not be viewed as optional observations, but as foundational elements of price action analysis. Consistently incorporating prior levels into trading decisions allows for more precise entries, better risk management, and a deeper understanding of market behavior.