


In the ever-dynamic world of forex trading, certain price levels naturally capture traders’ attention. These pivotal points, often referred to as psychological levels, tap into fundamental aspects of human behavior and decision-making. Let’s take a journey through the fascinating world of psychological levels and round numbers in forex trading, exploring their meaning, application, and relevance in the market.
What Are Psychological Levels and How Do They Work?
Imagine a trader scanning the forex market. Among the countless numbers flashing across the screen, the round figures like 1.3000 or 75.000 seem to stand out. These are psychological levels—key price points often associated with whole numbers. They act as natural barriers, serving as areas of support or resistance, thanks to human nature’s preference for simplicity.
Why do these levels hold such power? Traders tend to anchor their decisions around whole numbers, using them as points for entries, exits, or stop-loss orders. This collective behavior creates patterns in price action, altering the flow of orders and influencing market movements.
Identifying Psychological Levels on Forex Charts
The process of identifying these levels is straightforward. Traders commonly refer to whole number intervals as ‘double-zeros.’ These might appear as 1.31000 on EUR/USD, 1.57000 on GBP/USD, or 132.00 on GBP/JPY. To make things even more interesting, some traders also monitor levels halfway between these intervals, often called ‘the fifties’—such as 1.31500 on EUR/USD or 131.50 on GBP/JPY.
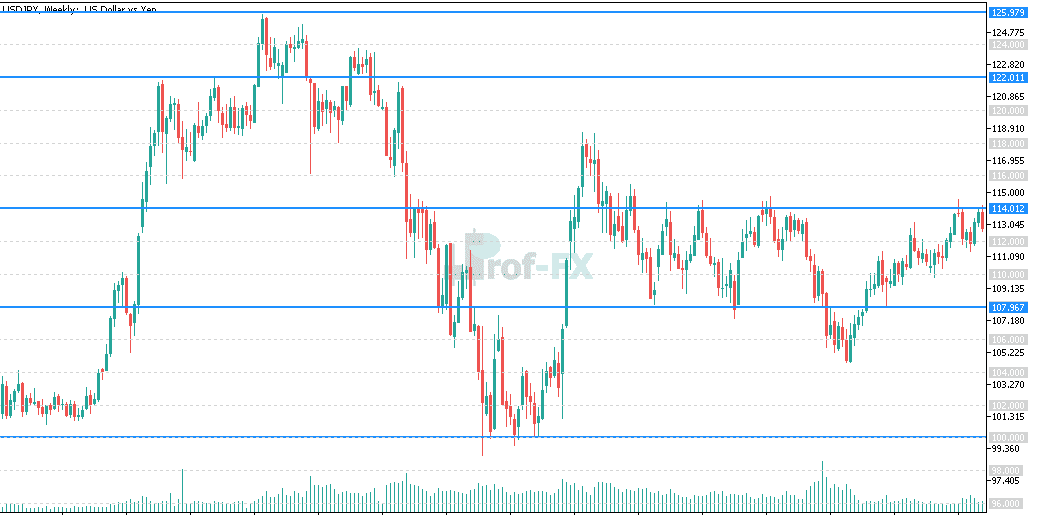
Picture a USD/JPY chart with key levels like 110.00 or 110.50 highlighted. Prices frequently cluster or reverse near these zones, creating what traders call “congestion.” This behavior underscores the importance of integrating psychological levels into support and resistance analyses.
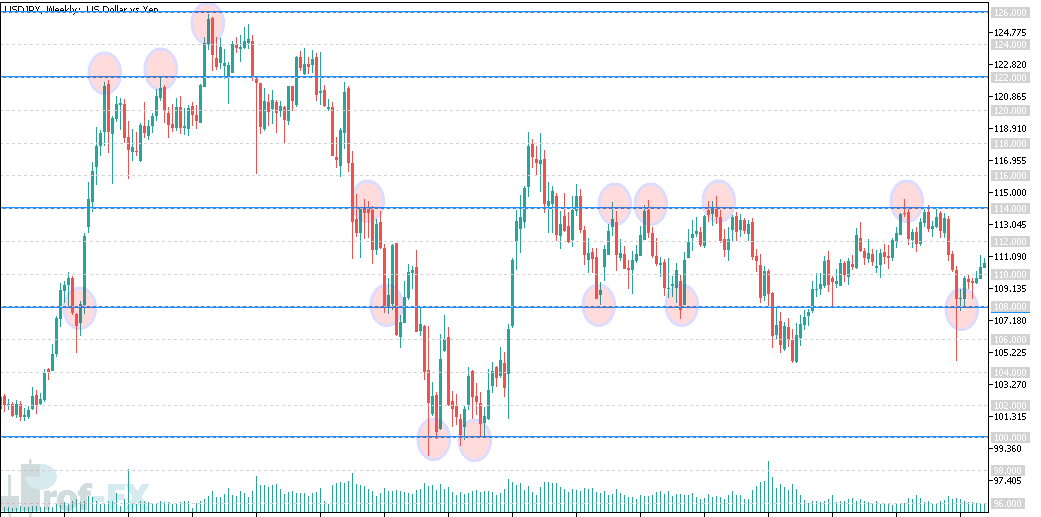
By observing historical price swings, traders can identify recurring patterns around these levels. Although not every level acts as support or resistance, enough do to warrant attention. The chart tells the story: prices bounce, stall, or reverse at these key points, signaling their relevance.
How to Use Psychological Levels in Forex Trading
Consider the AUD/JPY weekly chart. Time and again, the price approaches the 75.00 level, only to bounce back upward. Why does this happen?
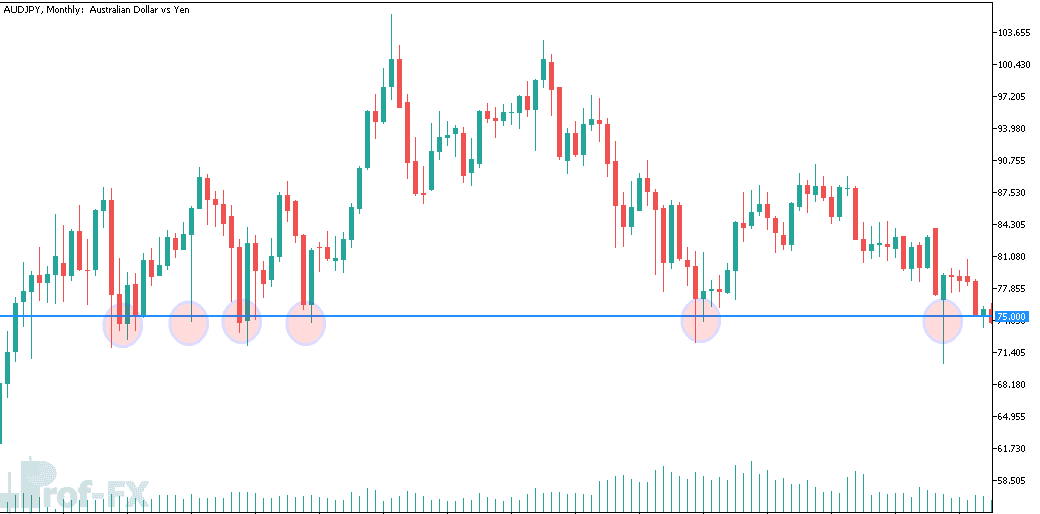
The narrative here is twofold:
- Buyers recognize value: At 75.00, traders perceive the pair as undervalued, prompting them to take long positions.
- Profit targets: Traders closing short positions often set profit targets at round numbers like 75.00. These closing orders create buying pressure, reinforcing the level’s significance.
This cycle builds a psychological barrier, making traders wary of pushing prices significantly beyond such points. Untested psychological levels, much like pivot points, signal potential areas of support or resistance. While levels like 70.000 on AUD/JPY draw significant attention, less rounded figures, such as 71.000, might not carry the same weight.
Advantages and Limitations of Psychological Levels
Psychological levels offer clear benefits, especially for traders looking to simplify their technical analysis. However, like any tool, they have their limitations. Let’s break them down:
Advantages:
- Serve as reliable points of support and resistance.
- Easy for beginner traders to spot and apply.
- Universally applicable across financial markets.
Limitations:
- Not foolproof; some levels fail to act as key price barriers.
- Best used in conjunction with other technical indicators or analysis techniques.
Ultimately, the true value of these levels emerges when they align with broader market trends and other technical signals. For example, historical reactions at these levels can amplify their significance, creating a “self-fulfilling prophecy” that savvy traders can leverage.
Enhancing Your Trading Knowledge
Ready to dive deeper into trading strategies? Explore our comprehensive Guide to Support and Resistance Trading or discover how price action can shape your trading decisions. If you’re new to forex, our Forex for Beginners Trading Guide is the perfect starting point.
The forex market is a complex landscape, but psychological levels and round numbers offer a beacon of simplicity amid the chaos. By understanding these levels, traders gain an edge—turning the ordinary into extraordinary.


