


A Closer Look at Simple Moving Averages (SMA)
Moving averages are among the most widely used tools in forex trading due to their simplicity and versatility. Traders rely on these indicators to make informed decisions about market trends and entry points. Commonly used Simple Moving Averages (SMAs) include the 10, 20, 50, 100, and 200-period moving averages. These choices depend on the trader’s style and the specific time frame they focus on.
Shorter, faster-moving averages often serve as entry triggers, while longer, slower-moving averages act as filters for determining the overall trend.
Exploring Exponential Moving Averages (EMA)
Exponential Moving Averages (EMAs) are similar to SMAs but differ in how they are calculated. The EMA gives more weight to recent price movements, making it more responsive to current market activity. Popular EMAs also include the 10, 20, 50, 100, and 200 periods. For traders who prefer Fibonacci-based strategies, replacing these standard values with Fibonacci numbers is a common approach.
Standard Moving Average Settings:
MA 20 – 50 – 100 – 200 – x
Fibonacci-Based Moving Averages:
MA 21 – 55 – 100 – 200 – x
Traders have access to various moving averages, each calculated differently to track price more accurately. Over time, these formulas have evolved to offer distinct advantages. Some of the most popular moving averages include:
- Hull Moving Average
- Weighted Moving Average
- Smoothed Moving Average
- Simple Moving Average
- Exponential Moving Average
For a deeper dive into how SMAs and EMAs are calculated, read our detailed article on moving averages.
Why Moving Averages Are a Go-To Tool
Moving averages are valued for their ability to help traders identify trending, ranging, or corrective market conditions. Many traders use a combination of two moving averages to create a trend-following strategy. For instance, when a shorter moving average crosses above a longer one, it often signals a buy opportunity. This bullish sentiment typically holds until the moving averages reverse or the trade hits its target.
The EUR/USD chart below demonstrates how the 200-day moving average can act as support and serve as a reliable trend filter. Notice how price approaches the 200-day MA before bouncing back in the direction of the prevailing long-term trend.
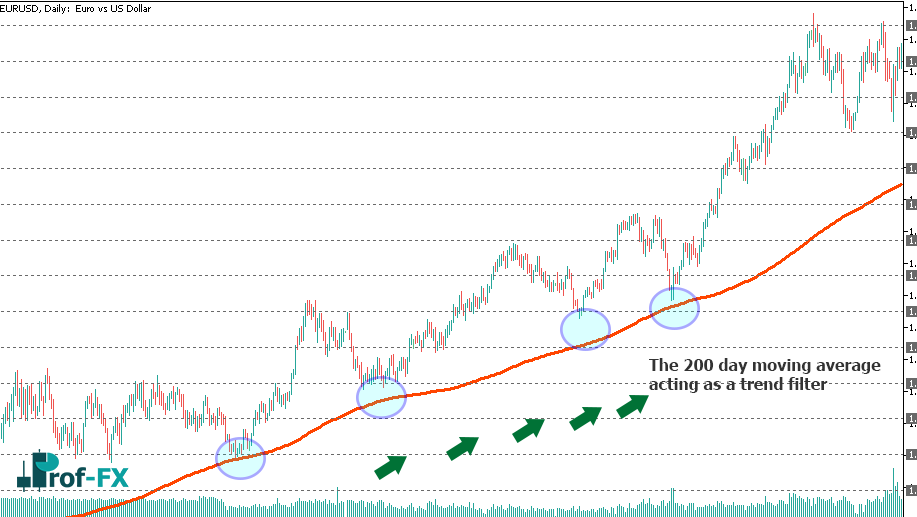
Pro Tip: Focus on a few key moving averages rather than chasing the elusive “perfect” one. This keeps traders grounded and helps them assess whether a trend is beginning, accelerating, or losing momentum.
Who Benefits from Moving Averages?
Moving averages are particularly appealing to new traders because they simplify the process of identifying trends and potential entry points. However, they’re also used by seasoned professionals, including fund managers and investment banks, to gauge market support, resistance levels, and possible reversals.
For instance, the EUR/USD chart below illustrates how price momentum slows in a long-term uptrend as it closes below the 200-day moving average. Such a move could signal a potential trend reversal.
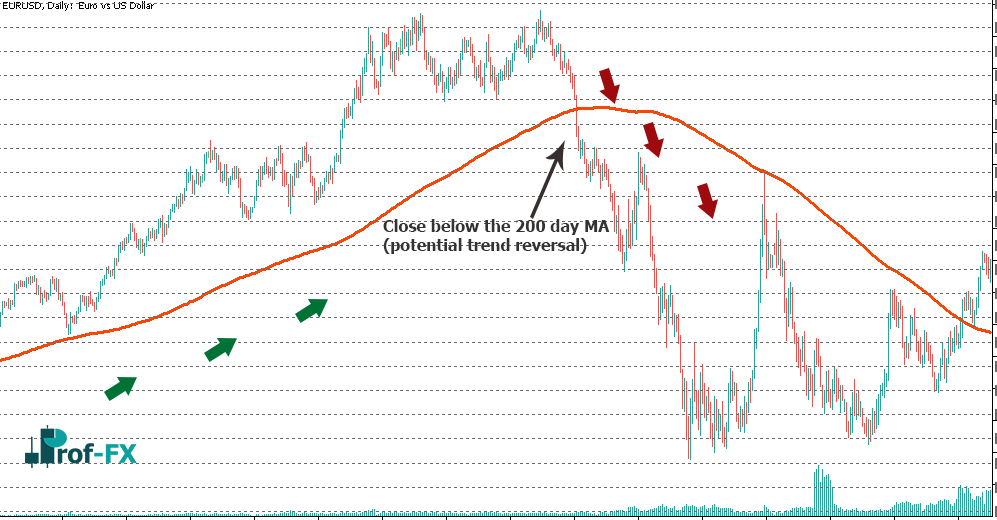
In strong trends, moving averages often define support and resistance levels. When price bounces off a moving average in a strong trend, it can provide opportunities to join the trend. Conversely, if price fluctuates above and below a moving average over a short period, the market may be ranging, reducing the significance of those reversals.
How to Leverage Popular Moving Averages
A straightforward strategy for using moving averages is the crossover method. Traders monitor when a faster moving average crosses above a rising slower moving average as a buy signal. Conversely, a sell signal occurs when a faster moving average crosses below a declining slower moving average.
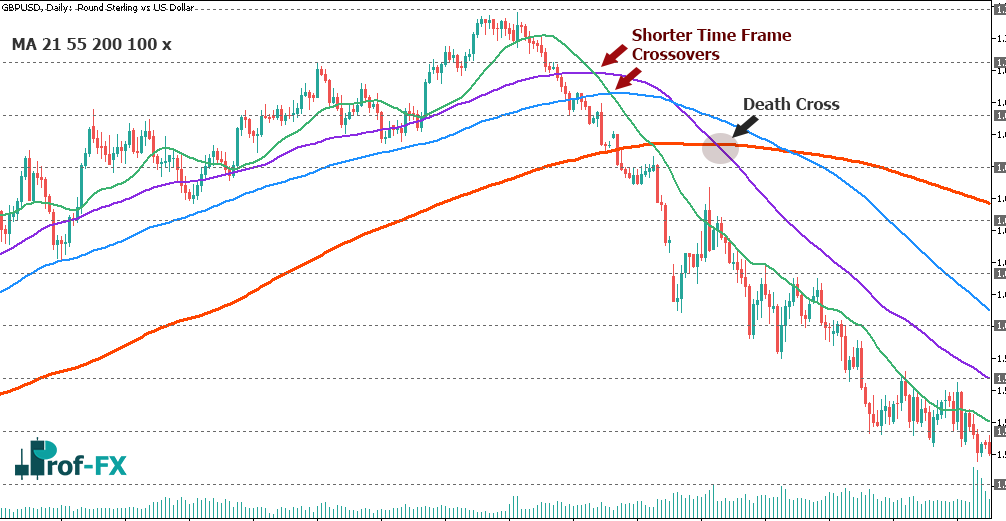
The 50 and 200 moving averages are the most recognized in crossover strategies:
- Golden Cross: The 50 MA crosses above the 200 MA, indicating a bullish crossover.
- Death Cross: The 50 MA crosses below the 200 MA, signaling a bearish crossover.
The GBP/USD chart below provides a clear example of the Death Cross:
FAQs: Mastering Moving Averages
What time frame should I use with moving averages?
Moving averages work on any time frame. Your choice depends on your trading style. Scalpers who focus on short-term trades might use hourly or 15-minute charts, while traders with limited time may prefer 4-hour or daily charts.
Can moving averages guide trade exits?
Yes, moving averages are as effective for exits as they are for entries. For instance, a bearish crossover during a long position can signal an exit. Knowing when to exit a trade is vital to success, as shown in our research on traits of successful traders.
By integrating moving averages into your strategy, you can gain a clearer perspective on market trends and enhance your decision-making process in the forex market.


