


One of the most important skills a forex trader can develop is the ability to recognize early signs of a potential market reversal – especially when those signals appear in alignment with the broader trend. While no trading signal offers certainty, understanding how price action behaves around key levels can provide a meaningful edge.
Before focusing on any candlestick signal, a trader must first identify the dominant market direction, often referred to as the longer-term trend. Trading in the direction of that trend consistently offers a higher probability of success than attempting to predict countertrend reversals.
Once the trend is clearly defined, traders can then look for entry signals that align with that trend, particularly during temporary pullbacks or retracements.
Start With the Bigger Picture: Identifying Trend Direction
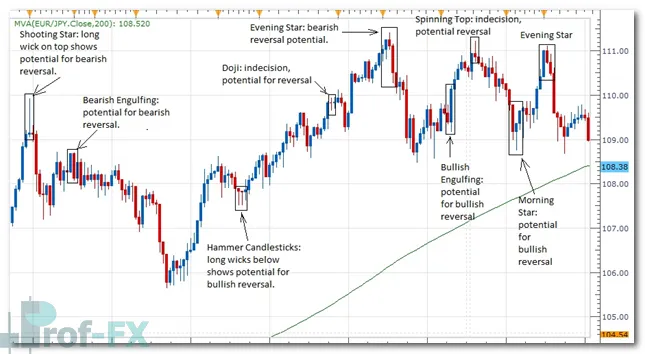
Let’s begin with a practical example using the EUR/JPY currency pair on a 4-hour chart.
In the chart below, the pair is clearly trading in an uptrend, supported by two key factors:
- Price is trading above the 200 Simple Moving Average (SMA)
- At the time of analysis, the euro (EUR) was fundamentally stronger than the Japanese yen (JPY)
Together, these factors establish a bullish bias.
When price remains above a long-term moving average such as the 200 SMA, it often reflects sustained buying pressure and institutional participation. In this environment, traders should prioritize long opportunities, not short ones.
Using Candlestick Patterns to Spot Trend Continuation Reversals
When a market is trending higher, traders should not look for bearish reversals. Instead, they should look for bullish reversal patterns that form after a pullback, signaling that price may be ready to resume the dominant uptrend.
In an uptrend, the most useful candlestick signals include:
- Hammer
- Doji
- Bullish Engulfing
- Morning Star
These candlesticks and patterns become particularly meaningful when they form:
- At the end of a retracement
- Near a clearly defined support level
- In alignment with the broader trend
When this confluence occurs, it serves as a strong “tip” that price action may reverse back in the direction of the prevailing trend. While nothing in trading is guaranteed, these setups shift probability in the trader’s favor by aligning price structure, trend direction, and market psychology.
What About Downtrends? Reading Bearish Reversal Signals
The same logic applies when a market is trending lower.
If the broader trend is bearish, traders should focus on bearish reversal candlestick patterns that appear after price pulls back toward a resistance area. These patterns suggest that selling pressure may soon resume.
Common bearish reversal patterns include:
- Shooting Star
- Bearish Engulfing
- Doji
- Evening Star
- Spinning Top
These patterns often appear near resistance levels during corrective moves within a downtrend.
While price does frequently reverse after these candlestick formations appear, it is important to remember that the highest-probability trades still occur in the direction of the prevailing trend, not against it. Trend alignment remains the cornerstone of professional trading.
Combining Candlestick Patterns With Indicators
Candlestick analysis does not require traders to abandon their preferred indicators. In fact, candlestick patterns often become more powerful when used in conjunction with technical indicators.
Indicators such as:
- MACD
- Stochastics
- RSI
can help confirm momentum, trend strength, or overbought and oversold conditions. When an indicator aligns with a strong candlestick pattern at a key technical level, the trade setup gains additional confirmation.
Rather than relying on a single tool, experienced traders build layers of confirmation, using price action, candlestick patterns, indicators, and trend analysis together.
Final Takeaway for Traders
Candlestick patterns do not predict the future – but they do offer valuable insight into market sentiment and potential turning points. When used in the context of:
- A clearly defined trend
- Key support or resistance levels
- Complementary technical indicators
they provide that extra “tip” traders look for when evaluating whether a currency pair may be ready to reverse and continue in its dominant direction.
This structured, probability-based approach helps traders move away from guesswork and toward disciplined, repeatable decision-making—an essential step toward long-term success in the forex market.


