


Understanding how to measure volatility is a fundamental skill for every forex trader. Volatility reflects how much price fluctuates over a specific period of time, and it plays a crucial role in determining strategy selection, risk management, and position sizing. Without a clear grasp of volatility, traders often misjudge market conditions and expose themselves to unnecessary risk.
In this guide, I will walk you through the concept of volatility, why it matters, and how traders can objectively measure it using one of the most respected tools in technical analysis—the Average True Range (ATR) indicator.
What Is Volatility in Forex Markets?
Volatility refers to the degree of price variation over a given time period. When prices move aggressively with large swings, the market is considered highly volatile. Conversely, when price action is subdued and confined within a narrow range, volatility is considered low.
From a trader’s perspective, volatility is a double-edged sword. On one hand, larger price movements create more opportunity for profit. On the other hand, they also increase uncertainty and risk. This is why professional traders focus not only on identifying trade setups, but also on understanding the current volatility environment before committing capital.
Volatility is not random. It expands and contracts based on factors such as:
- Economic data releases
- Central bank decisions
- Market sentiment and risk appetite
- Liquidity conditions across trading sessions
Recognizing these shifts allows traders to align their strategies with prevailing market conditions.
Why Volatility Matters More Than Most Traders Realize
Price movement is the raw material of trading profits. However, more movement does not automatically mean better trading conditions. High volatility environments often produce sharp reversals, false breakouts, and rapid drawdowns—especially harmful for inexperienced traders.
One of the most common mistakes new forex traders make is underestimating risk during volatile periods. Stops that are too tight, oversized positions, or emotional decision-making can quickly lead to significant losses or even margin calls.
This is why volatility should always be evaluated before entering a trade. It helps traders answer critical questions:
- Should I trade this market at all?
- Is this environment better suited for range trading or breakout strategies?
- How wide should my stop loss be?
Without this context, even a technically sound setup can fail.
The Average True Range (ATR): A Professional Volatility Tool
Among the many indicators available, the Average True Range (ATR) stands out as one of the most effective and widely used measures of volatility. Developed by J. Welles Wilder—the same analyst behind RSI, Parabolic SAR, and ADX—ATR was designed specifically to quantify market volatility, not direction.
ATR is based on the concept of True Range, which captures the full extent of price movement, including gaps and sudden shifts. True Range is calculated as the greatest of the following three values:
- The current period’s high minus its low
- The current period’s high minus the previous close
- The current period’s low minus the previous close
By using absolute values, ATR ensures that volatility is measured objectively, regardless of whether price moves up or down.
Once the True Range values are calculated, they are averaged over a defined number of periods—14 periods is the industry standard—to produce the Average True Range.
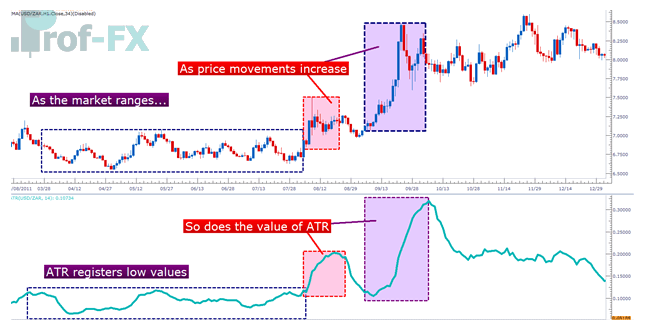
As volatility increases, ATR rises. When markets become quieter, ATR contracts. This makes ATR an excellent real-time gauge of changing market conditions.
How to Use ATR in Forex Trading
After learning how to measure volatility, traders can integrate ATR into their trading plans in two primary ways: as a volatility filter and as a risk management tool.
Using ATR as a Volatility Filter
Different volatility environments require different trading approaches. ATR helps traders determine whether the market is more suitable for range trading or breakout trading.
In low-volatility conditions, price often oscillates between well-defined support and resistance levels. In these environments, traders may look to buy support and sell resistance, assuming the range will persist.
Alternatively, some traders anticipate that prolonged low volatility will eventually lead to an explosive breakout. These traders position themselves for expansion in volatility, aiming to capture strong directional moves.
The distinction between these two approaches is critical. Range traders benefit from clear stop placement and higher probability setups, while breakout traders accept lower probability in exchange for potentially larger rewards. ATR helps identify which environment is currently in play, reducing the risk of applying the wrong strategy at the wrong time.
Using ATR for Risk Management and Stop Placement
One of the most practical applications of ATR is in setting stop-loss distances. Instead of using arbitrary pip values, traders can align their stops with current market volatility.
Because ATR expands and contracts with price movement, it naturally adjusts stop placement to market conditions. In volatile markets, wider stops are necessary to avoid being prematurely stopped out. In calmer markets, tighter stops may be sufficient.
ATR values are displayed in the same units as price. For example:
- An ATR reading of 00458 on EUR/USD equates to approximately 45.8 pips
- An ATR reading of 455 on USD/JPY equates to 45.5 pips
By basing stops on ATR multiples, traders introduce consistency and objectivity into their risk management process—an essential trait of long-term trading success.
Frequently Asked Question: What Is the Best Tool for Risk Management?
There is no single “best” tool for managing risk. However, extensive analysis of millions of live trades at Prof FX has shown that traders who consistently apply positive risk-to-reward ratios and limit exposure tend to perform significantly better over time.
As a general guideline:
- Risk no more than 1% of account capital per trade
- Limit total exposure to 5% across all open positions
- Avoid excessive leverage, especially during high-volatility periods
ATR is not a standalone solution, but when combined with disciplined position sizing and a structured trading plan, it becomes a powerful ally in protecting capital.
Final Thoughts on Measuring Volatility
Volatility is not something to fear—but it must be respected. Traders who learn to measure and adapt to changing volatility conditions gain a meaningful edge in the forex market. The Average True Range provides a clear, objective framework for understanding these conditions and aligning strategy, risk, and expectations accordingly.
Mastering volatility measurement is not about predicting the future. It is about preparing for uncertainty—and in trading, preparation is everything.


 Explained")


