


Like most candlestick formation patterns, the Harami tells a clear story about real-time market sentiment. Once the signal candle completes, traders can analyze the following candle to establish directional bias and define precise risk levels. This structured approach is what makes the Harami pattern especially attractive for traders looking to identify early trend reversals with controlled risk.
Why Japanese Candlesticks Matter in Forex Trading
Japanese candlestick charting predates many modern financial markets, and its longevity explains why it remains one of the most widely used forms of technical analysis today.
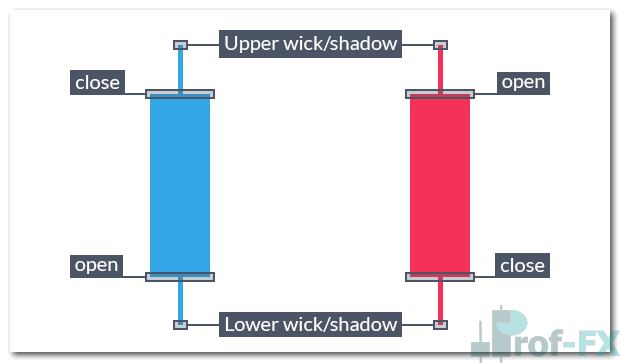
For traders new to candlestick analysis, this technique focuses on the relationship between:
- The real body (open and close)
- The shadows or wicks (high and low)
By studying these relationships, traders can gauge market sentiment in real time. One of the biggest advantages of candlestick analysis is its versatility—it can be applied across all timeframes and all markets, including forex, indices, commodities, and cryptocurrencies.
Reversal vs Continuation Candlestick Patterns
Candlestick trading signals are generally classified into two categories:
- Continuation patterns, which suggest that the current trend is likely to persist
- Reversal patterns, which signal that the prevailing trend may be losing momentum and could change direction
Reversal patterns are especially popular among forex traders because they offer opportunities to enter trades near market turning points, often with tight stop-loss placement and attractive risk-to-reward ratios.
The Doji Candlestick: A Warning Signal
When traders begin studying candlestick reversals, they are often introduced to the Doji candlestick early on.
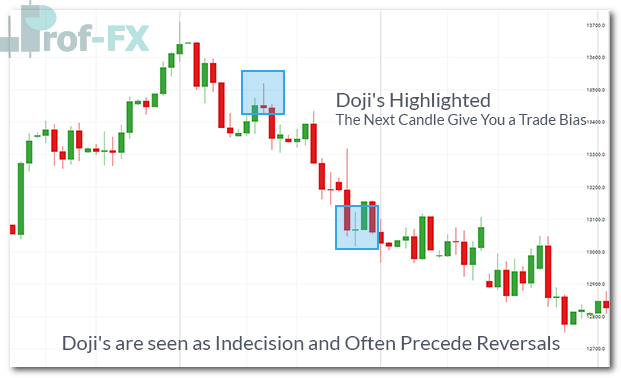
A Doji forms when price opens and closes at—or very near—the same level, creating a candle with a small body and visible upper and lower wicks, resembling a “+” shape. This formation signals indecision between buyers and sellers.
While a Doji alone does not confirm a reversal, it serves as a warning sign. The candle that follows the Doji is critical, as it reveals whether buyers or sellers ultimately gain control.
Enhancing Doji Signals with Technical Confluence
A Doji becomes significantly more powerful when it appears near:
- Key support or resistance levels
- Overbought or oversold conditions identified by oscillators
- Major moving averages
Indicators such as RSI, Stochastic Oscillator, or moving averages help traders determine whether price is in an extreme condition, which is where candlestick reversal patterns tend to be most effective.
Using indicators alongside candlestick patterns increases the probability of successful entries without changing the core candlestick signal.
The Power of the Harami Candlestick Pattern
The Harami is considered one of the most powerful Doji-based reversal patterns because it analyzes three candles, not just one.
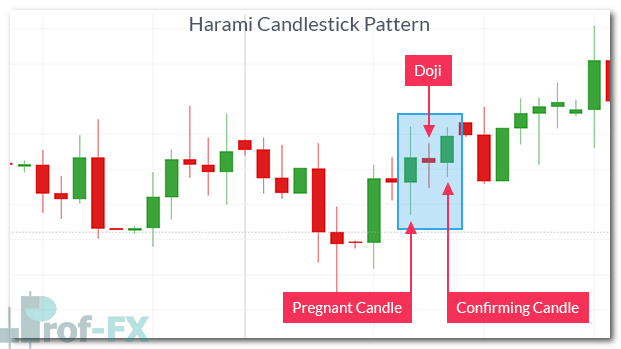
Structure of the Harami Pattern
1. First Candle
- Large real body
- Moves in the direction of the immediate trend
2. Second Candle (Doji or Small Body)
- Smaller body contained within the range of the first candle
- Signals a slowdown in momentum
3. Third Candle (Confirmation Candle)
- Confirms the reversal if it moves against the first candle
- Invalidates the signal if the trend resumes
The Harami is named after the Japanese word for “pregnant,” as the small second candle appears enclosed within the larger first candle—much like a pregnant figure.
Why the Harami Pattern Is Popular Among Traders
The appeal of the Harami pattern lies in its ability to:
- Identify potential reversals early
- Offer tight stop-loss placement
- Produce favorable risk-to-reward ratios
When risk is kept small and potential reward is large, traders do not need a high win rate to remain profitable. A single strong winning trade can offset several small losses—as long as position sizing and risk management are applied correctly.
This principle aligns closely with professional trading methodologies used by institutional and retail traders alike.
Market Psychology Behind the Harami Pattern
The true strength of the Harami comes from converging market forces. After a sustained move, traders aligned with the trend begin to take profits. As momentum slows, the Doji forms, signaling that the dominant side is no longer aggressively pushing price.
The near-equal open and close reflect hesitation, while the confirmation candle reveals whether this hesitation develops into a reversal. In essence, the Harami captures the moment when control shifts from trend followers to counter-trend participants.
Example: Bearish Harami Trade Setup
Bearish Harami – Short AUD/CHF
- Stop-Loss: Above the high of the first candle at 9630
- Take-Profit: In the direction of the new trend at 9375
This setup demonstrates how the Harami allows traders to define risk clearly while targeting a move that aligns with broader market structure.
Final Thoughts
The Harami candlestick pattern is a powerful tool for traders seeking high-quality reversal setups. When combined with support and resistance, oscillators, or moving averages, it becomes an even more reliable signal.
As with all trading strategies, success comes not from the pattern alone, but from discipline, confirmation, and proper risk management. Used correctly, the Harami can help traders position themselves early in a new market move—while keeping risk tightly controlled.
Happy trading.


