


Introduction: Building a Personal, Rule-Based Trading Strategy
In professional forex trading, consistency comes from having a clear, repeatable trading strategy. While there are many ways to approach the market, one of the most reliable methods – especially for beginner traders – is trading in the direction of the dominant trend using multiple timeframes.
In this article, I will walk you through a personal trading strategy that combines:
- Daily trend analysis
- 4-hour and 1-hour entry optimization
- Momentum confirmation using common indicators
The goal is not to overcomplicate the process, but to stack probabilities in your favor by aligning with the market’s broader direction.
Step One: Using the Daily Chart to Identify the Primary Trend
Although trades are occasionally taken directly from the Daily chart, its primary role in this strategy is trend identification.
Once I identify a currency pair that shows the strongest and cleanest trend, I then look to enter on either the 4-hour (H4) or 1-hour (H1) chart—whichever provides the most favorable risk-to-reward setup.
Let’s break this down step by step.
The Daily Chart Analysis: Defining Market Direction
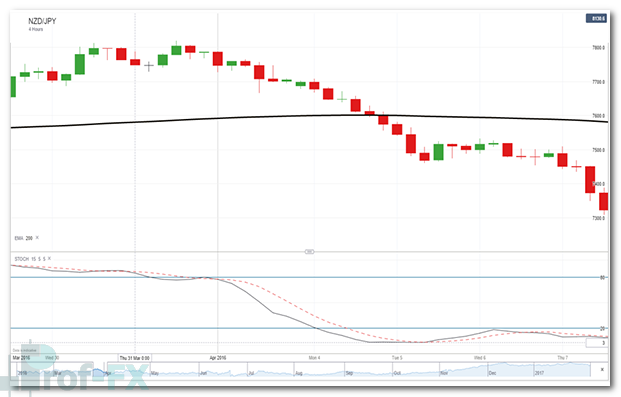
On the Daily chart, the trend for NZDJPY is clearly bearish. This conclusion is based on multiple technical and fundamental factors working together:
Key Trend Confirmation Factors:
- The pair is forming lower highs and lower lows, a classic downtrend structure
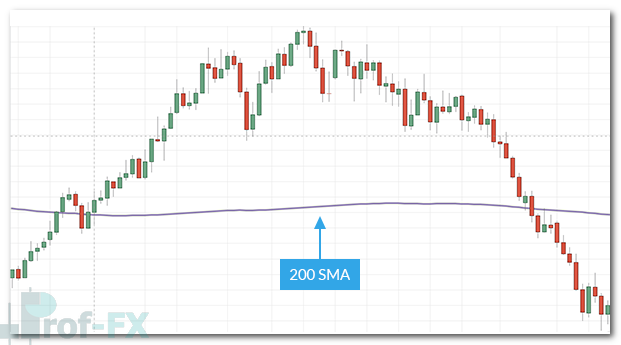
- Price action is trading below the 200 Simple Moving Average (200 SMA) and continues to move away from it
- At the time of analysis, the New Zealand Dollar (NZD) was the weakest major currency, while the Japanese Yen (JPY) was the strongest
- Slow Stochastics is positioned below the 20 level, indicating strong bearish momentum
When multiple signals align across price action, moving averages, momentum indicators, and relative currency strength, the probability of trend continuation increases significantly.
Trading Bias: Why Directional Discipline Matters
Given the evidence from the Daily chart, the trading bias is clear:
Only sell opportunities will be considered on NZDJPY.
This is a critical mindset shift for many beginner traders. Trading exclusively in the direction of the longer-term trend provides a measurable edge and removes unnecessary decision-making.
Trying to buy against a strong Daily downtrend may feel tempting – but it often leads to lower-probability trades and emotional stress.
Step Two: The 4-Hour Chart – Waiting for the Right Moment
After identifying the Daily trend, the next step is to move to the 4-hour chart to look for a retracement – a temporary move against the Daily trend.
What we want to see:
- The retracement losing momentum
- A fresh move beginning back in the direction of the Daily trend
In simple terms, we are waiting for price to reset before continuing lower.
Patience Is Part of the Strategy
In this specific 4-hour example, a new bearish move has already occurred, visible through the five consecutive red candles on the right side of the chart. Because of this, the correct action is to wait.
Professional trading is often about doing nothing until conditions realign. Entering late after a strong move has already occurred usually leads to poor risk-to-reward outcomes.
Step Three: Refining Entries on the 1-Hour Chart
The same analytical process used on the 4-hour chart is then applied to the 1-hour chart. This timeframe often provides:
- More precise entries
- Smaller stop losses
- Better trade management flexibility
What We Are Waiting For:
- A pullback or retracement against the Daily downtrend
- Momentum shifting back to the downside
Because NZDJPY is in a strong and persistent Daily downtrend, selling after retracements offers repeated, high-probability opportunities.
Entry Execution and Momentum Confirmation
Once a retracement completes, a short position is opened when bearish momentum resumes.
Momentum can be confirmed using familiar indicators such as:
- Stochastics (bearish crossover)
- MACD
- RSI
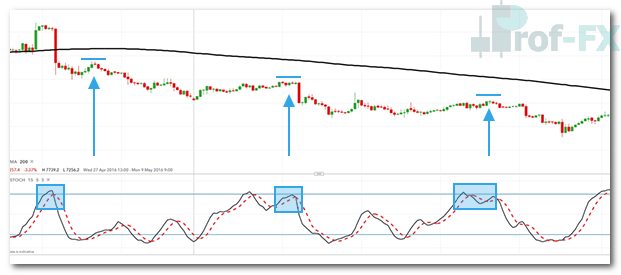
In this example:
- Entries occur when Stochastics crosses down, highlighted by the black circles
- The stop loss is placed above the most recent swing high, marked by the black horizontal lines
This ensures risk is:
- Clearly defined
- Technically justified
- Consistent across trades
Managing Trader Psychology During Retracements
Sidebar for Beginner Traders
Many traders become uncomfortable – or even frustrated – when price temporarily moves against the Daily trend.
This reaction is normal, but it’s important to understand:
- Retracements are healthy market behavior
- They create new opportunities to enter at better prices
Instead of worrying, view retracements as preparation phases. Once they end, price often resumes its primary trend with renewed momentum.
Key Lessons from This Trading Strategy
- Always start with the Daily chart to define trend direction
- Trade only in the direction of the dominant trend
- Use 4-hour and 1-hour charts to fine-tune entries
- Let retracements complete before entering
- Confirm entries with momentum indicators
- Place stops beyond recent swing highs or lows
- Patience and discipline are as important as technical skill
Final Thoughts: Simplicity Creates Consistency
This personal trading strategy is not about predicting the market – it’s about reacting to what price is already telling us. By aligning with the Daily trend and executing on lower timeframes, traders can reduce emotional decisions and improve consistency over time.
For beginner forex traders, mastering this multi-timeframe, trend-following approach lays a strong foundation for long-term success.


