MACD histogram talking points:
- The MACD as a lagging indicator
- MACD histogram: What does the histogram represent?
- Using MACD histograms to identify bullish/bearish biases
The MACD as a Lagging Indicator
The Moving Average Convergence/Divergence (MACD) is a widely respected technical indicator that uses exponential moving averages (EMA) to evaluate trend strength, momentum, and potential entry points through crossover signals.
Many traders who use the MACD are often critical of the fact that it may generate an entry signal only after the initial move has already begun, which can result in leaving valuable pips on the table. For this reason, some traders seeking earlier market entries often classify it as a lagging indicator and may choose to dismiss it prematurely.
From a technical analysis standpoint, a lagging indicator is any indicator that relies on historical price data to produce its signals. In reality, all indicators are inherently lagging to some degree because they are calculated from price action that has already occurred and then interpreted in the context of current market conditions.
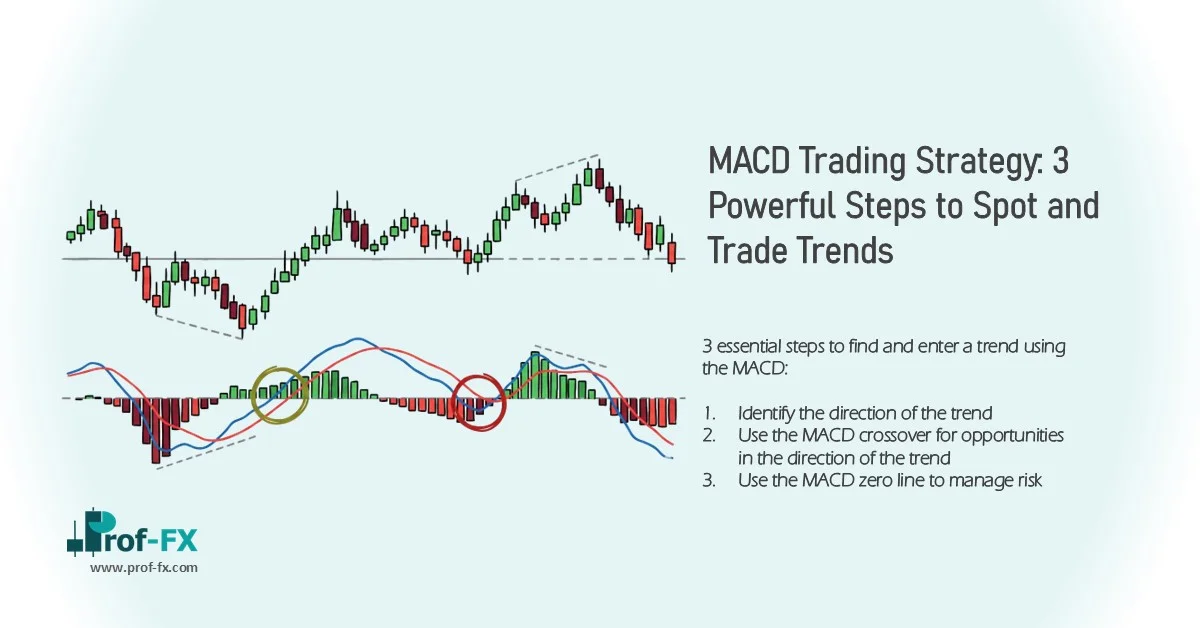
In the case of the MACD, the most commonly used entry signal occurs when the MACD line crosses the signal line in the direction of the prevailing trend.
Because both lines are derived from moving averages, the crossover naturally occurs only after price has already started moving. This delay is not necessarily a weakness. In fact, many experienced traders prefer this method because it provides stronger confirmation that momentum is likely to continue in that direction.
However, for traders who prefer earlier entries, the MACD histogram can often provide a faster and more responsive signal.
MACD Histogram: What Does the Histogram Represent?
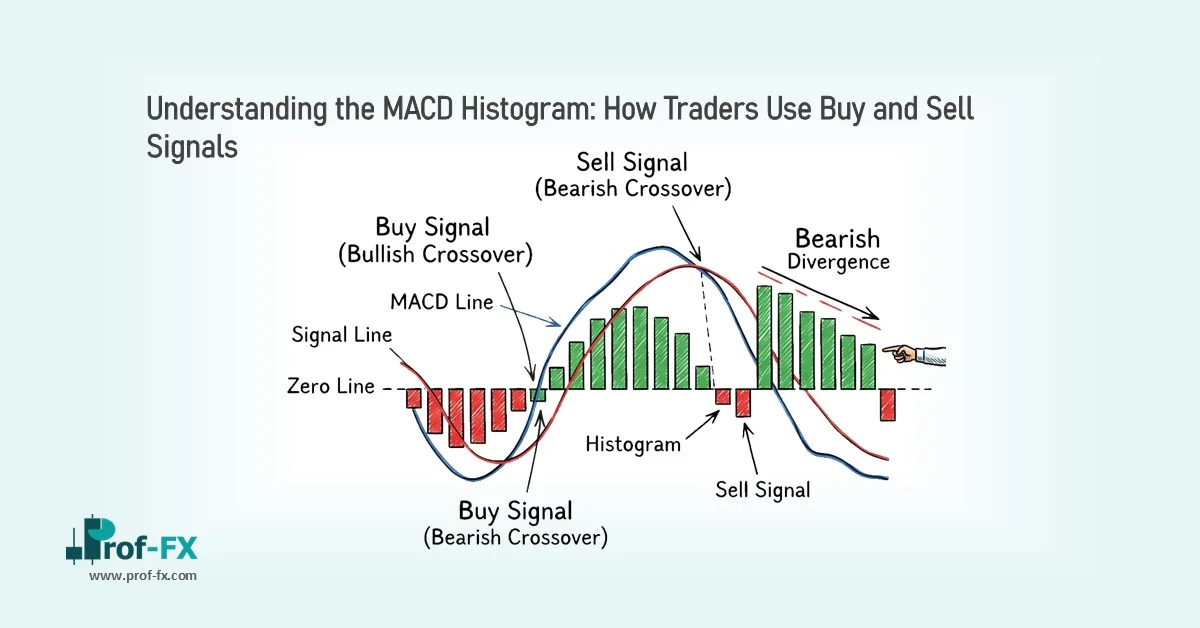
The histogram, often displayed as a background bar chart within the MACD indicator, represents the numerical difference between the MACD line and the signal line.
- When the MACD line is above the signal line, the histogram bar is positive
- When the MACD line is below the signal line, the histogram bar is negative
The actual height of each bar reflects the magnitude of the difference between these two lines.
In practical terms, the histogram visually displays whether momentum is expanding or contracting, making it a highly effective tool for spotting momentum shifts earlier than a standard crossover.
MACD histogram:

For more aggressive traders who are less concerned with additional confirmation and are primarily focused on securing an earlier entry, the histogram-based signal is often preferred.
This less commonly used entry technique can provide a faster trigger because the histogram reacts more quickly than the full MACD crossover setup.
The reason for this is that histogram momentum changes are often visible before the MACD and signal lines physically cross, allowing traders to anticipate potential directional shifts with greater speed.
This creates a notable timing advantage compared to waiting for the traditional crossover.
MACD crossover vs MACD histogram:

Using MACD Histograms to Identify Bullish/Bearish Biases
The first stage of analysis is to observe the histogram as it moves away from the zero line, whether into positive or negative territory.
Traders should monitor the histogram bars as they increase in size, since expanding bars indicate strengthening momentum in the current direction.
The actual signal emerges when the histogram stops increasing in height and instead produces a smaller bar than the previous one.
This contraction often suggests that momentum is beginning to weaken.
Once a smaller bar is printed, traders may consider entering a trade in the direction of the histogram’s decline, as this often precedes a crossover or short-term reversal in momentum.
From a professional trading perspective, this is one of the most effective ways to identify early momentum exhaustion.
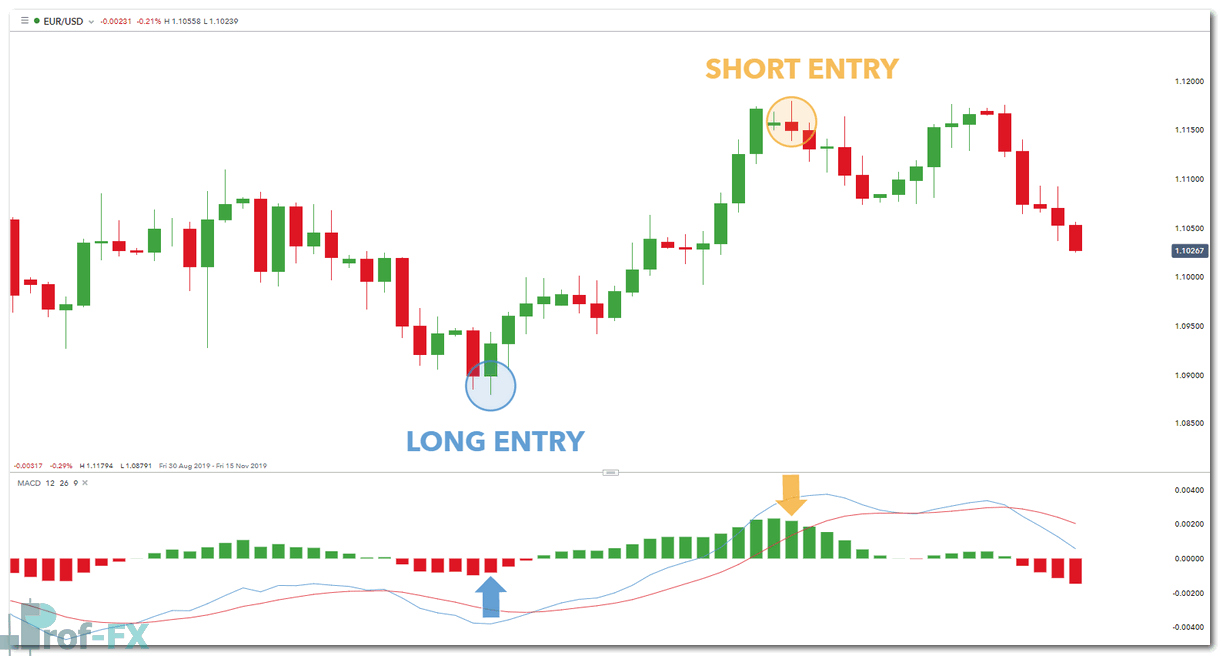
The suggestive buy signal on the left (blue) was formed after five expanding red bars in succession, followed by a fifth bar that closed smaller than the previous one.
This contraction indicated weakening bearish momentum and provided an early buy signal.
Two bars later, the MACD line crossed above the signal line, producing the traditional MACD confirmation signal.
By that stage, however, a substantial portion of the upside move had already taken place.
This clearly demonstrates how the histogram signal can capture earlier price movement that a standard crossover may miss.
The suggestive sell signal on the right (yellow) follows the same logic.
In this case, the histogram produced fourteen consecutive expanding bars before a contracted fifteenth bar appeared.
This weakening of bullish momentum offered an early sell signal, several bars before the MACD and signal line crossover occurred.
For traders focused on timing and maximizing risk-to-reward, this earlier signal can be strategically valuable.
EUR/USD MACD histogram buy sell signal:
Learn More About Technical Indicators
Strengthen your core understanding of technical indicators for Forex traders to build a more robust trading framework.
It is also highly recommended to improve your knowledge of price action, which remains one of the most important primary indicators in market analysis.
Professional technical traders often develop different trading styles and Forex trading strategies, ranging from trend-following systems to breakout and reversal methods.
Exploring these approaches thoroughly is essential to determine whether this style of analysis aligns with your trading personality, risk tolerance, and execution style.
If you are just beginning your trading journey, it is critical to first master the fundamentals of the market through our new to Forex guide.