Understanding the Doji Candlestick in Trading
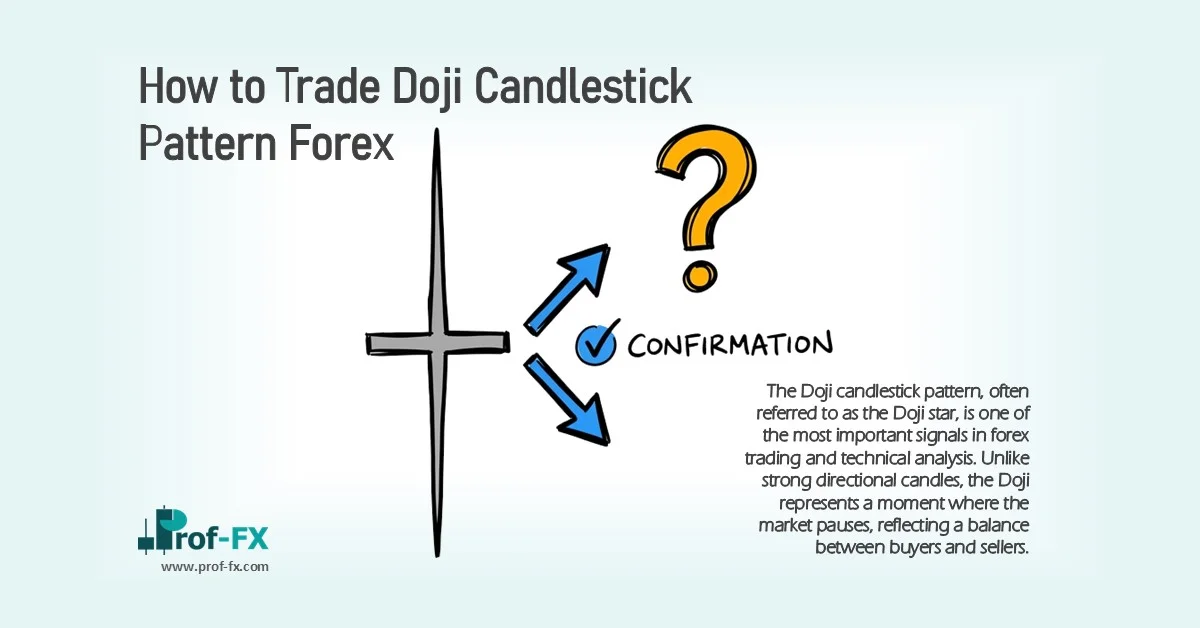
The Doji candlestick pattern, often referred to as the Doji star, is one of the most important signals in forex trading and technical analysis. Unlike strong directional candles, the Doji represents a moment where the market pauses, reflecting a balance between buyers and sellers.
For traders, especially beginners, this pattern is not just about indecision, it is about recognizing potential turning points or continuation signals, depending on the broader market context.
In this guide, we will cover:
- What the Doji candlestick is
- The different types of Doji patterns
- Practical strategies to trade the Doji effectively
What Is a Doji Candlestick and How Does It Work?
A Doji candlestick forms when the opening and closing prices are equal or very close, resulting in a candle with a very small or non-existent body.
Structure of the Doji
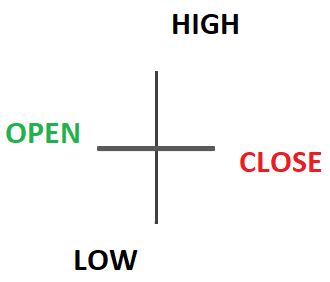
This creates a distinctive cross-like shape, often with:
- Upper and lower wicks of similar length
- Minimal real body
This formation indicates that:
- Buyers pushed prices higher
- Sellers pushed prices lower
- But neither side gained control
In most cases, the Doji reflects market indecision or a slowdown in momentum.
Why the Doji Matters in Technical Analysis
The Doji provides traders with a valuable “pause and reflect” signal.
When it appears:
- After an uptrend → buying momentum may be weakening
- After a downtrend → selling pressure may be fading
However, it is critical to understand that:
The Doji alone is not a trading signal, it is a warning that a decision point is approaching.
Practical Insight for Traders
- Traders may consider exiting trades when a Doji appears against their position
- But confirmation from indicators or price structure is essential
- Markets can remain indecisive briefly and then continue the trend
Understanding Doji Candlestick Variations
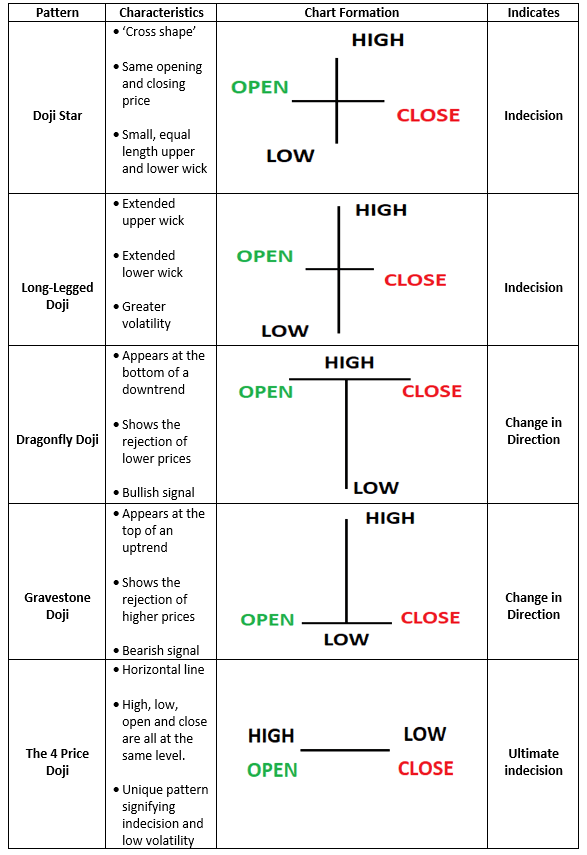
Not all Doji candles signal the same thing. There are five main types, each offering different insights into market behavior.
Common Doji Variations
- Standard Doji → Neutral indecision
- Dragonfly Doji → Bullish rejection of lower prices
- Gravestone Doji → Bearish rejection of higher prices
- Long-Legged Doji → High volatility and indecision
- Doji Star → Potential reversal signal in context
In real market conditions, especially in forex, perfect Doji formations are rare. Traders should look for approximate structures rather than exact shapes.
How to Trade the Doji Candlestick Pattern
Professional traders always combine the Doji with confirmation tools such as indicators, support/resistance, and trend analysis.
Below are three practical strategies you can apply.
Strategy 1: Trading the Doji at Market Reversals
When a Doji appears at the end of a trend, it can signal a potential reversal.
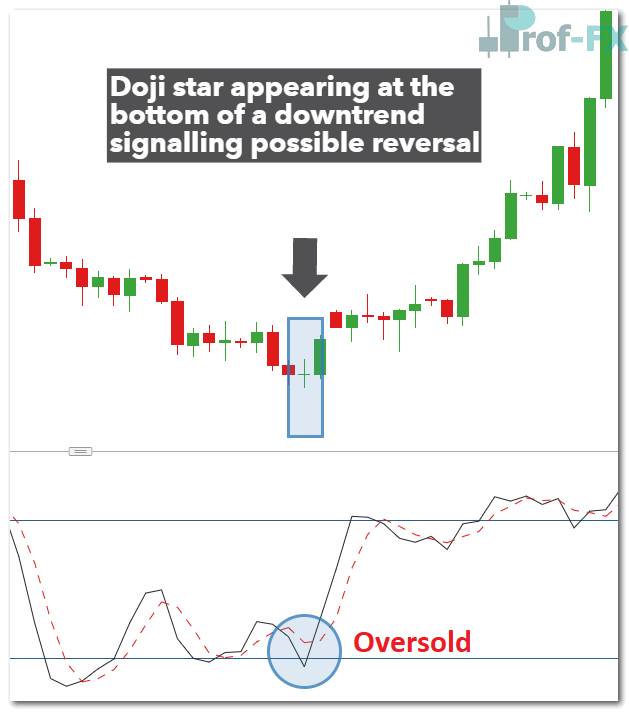
Example Setup (GBP/USD)
- Market is in a downtrend
- A Doji forms at the bottom
- A Stochastic indicator shows oversold conditions
Trade Execution
Entry:
Enter after confirmation, such as a bullish candle closing above the Doji.
Stop Loss:
Place below the low of the Doji.
Take Profit:
Target nearby resistance levels or previous highs.
Strategy 2: Using the Dragonfly Doji with Support Levels
The Dragonfly Doji is particularly effective when it appears near support levels.
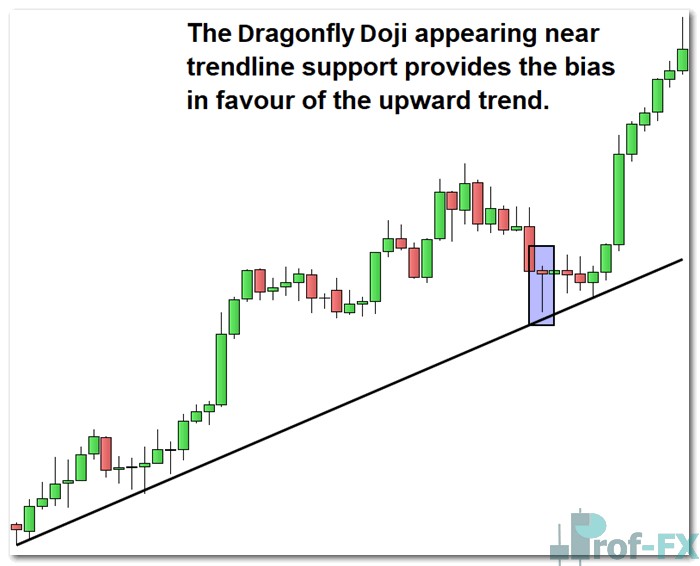
Market Interpretation
- Price attempts to move lower
- Buyers reject those levels
- Candle closes near the opening price
This shows strong bullish rejection, especially when aligned with:
- Trendline support
- Historical price levels
Trade Approach
- Enter after bullish confirmation
- Place stop below the wick
- Target higher resistance levels
Strategy 3: The Double Doji Breakout Strategy
A single Doji signals indecision, but two consecutive Dojis often indicate a major breakout is coming.
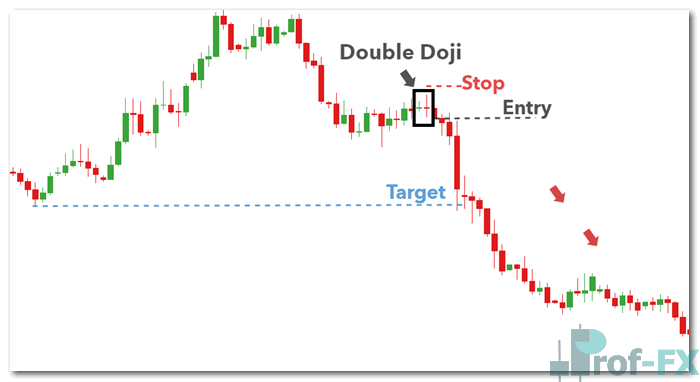
How It Works
- Market consolidates with two Dojis
- Neither buyers nor sellers gain control
- A strong directional move follows
Trade Setup
Entry:
Enter on breakout above or below the range formed by the two Dojis.
Stop Loss:
Place beyond the opposite side of the Doji range.
Take Profit:
Target key levels or use a trailing stop to capture extended moves.
Advantages and Limitations of the Doji Pattern
Advantages
- Clearly highlights market indecision
- Helps identify potential reversals or breakouts
- Works across all markets and timeframes
Limitations
- Not a standalone signal
- Requires confirmation from:
- Indicators (RSI, Stochastic)
- Support and resistance levels
- Can produce false signals in low-volatility markets
Final Thoughts on Trading the Doji Candlestick
The Doji candlestick is less about action and more about awareness.
It tells a simple but powerful story:
The market is undecided and a significant move may be approaching.
As a trader, your role is to:
- Wait for confirmation
- Align with market structure
- Manage risk effectively
When used correctly, the Doji becomes a valuable tool for identifying high-probability trading opportunities.
Continue Learning Candlestick Trading
The Doji is just one of many essential candlestick patterns. To build a complete trading strategy, consider learning:
- Engulfing patterns (bullish and bearish)
- Hammer and shooting star patterns
- Multi-timeframe analysis
- Risk management techniques
Consistency in trading comes from combining price action, confirmation tools, and disciplined execution.