


Pennant patterns are powerful continuation signals in the forex market, often leveraged by traders to anticipate potential price movements. While they may resemble triangle patterns, Pennants have distinct characteristics that set them apart, making them an essential tool for savvy traders.
This forex education dives deep into understanding Pennant chart patterns, their significance, the forces driving them, and, most importantly, how to incorporate them into your trading strategy for better results.
What is a Pennant Pattern?
A Pennant pattern is a continuation chart pattern that emerges after a significant upward or downward price move. This initial movement is followed by a brief consolidation period, culminating in the price resuming its original direction. The pattern takes the shape of a small, symmetrical triangle, aptly named a Pennant, and is composed of multiple forex candlesticks. Based on the trend direction, Pennants are classified as either bullish or bearish.
Key Features of a Pennant Pattern
When analyzing a Pennant pattern, you’ll notice three critical elements:
- Flagpole: The Pennant pattern starts with a strong price movement, known as the flagpole. This is what sets it apart from other patterns like the symmetrical triangle.
- Breakout Points: There are two distinct breakouts—one at the end of the flagpole and another following the consolidation phase, where the trend resumes.
- The Pennant: Formed during the consolidation period, the Pennant is a triangular shape created by converging trendlines.
These components work together to indicate a continuation in the price’s direction, as illustrated in the Bullish Pennant Pattern below.

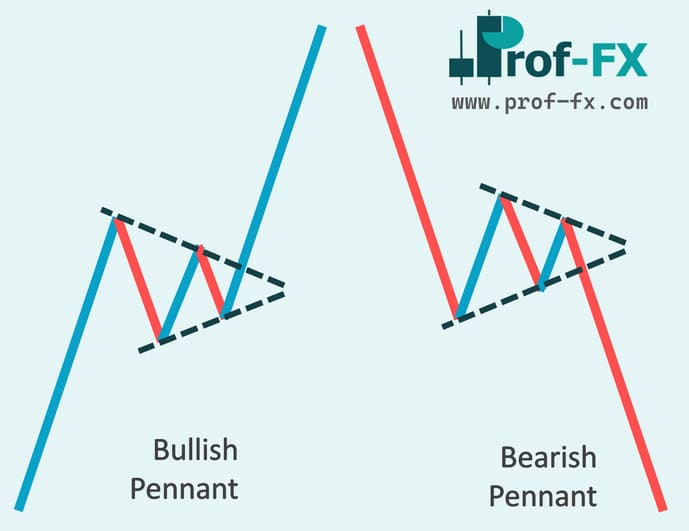
Bullish Pennants
Bullish Pennants occur within strong uptrends, signaling continued upward momentum. They begin with a sharp upward flagpole, followed by a consolidation phase, and culminate in a breakout that continues the upward trajectory. Traders typically enter long positions when the price breaks above the Pennant, capitalizing on the renewed bullish drive.

Bearish Pennants
In contrast, Bearish Pennants develop during pronounced downtrends. They begin with a steep decline (flagpole), followed by a pause in price movement that forms the triangular Pennant. Once the breakout occurs, the downward trend resumes. Traders use the breakout below the Pennant as an entry point for short positions.

Differentiating Pennants from Triangle Patterns
Although Pennant patterns share similarities with triangle patterns, understanding their differences is vital for effective trading:
- A Pennant must be preceded by a robust upward or downward move, forming a flagpole. Without it, the pattern is a triangle, not a Pennant.
- Pennants typically have a shallow retracement of less than 38% of the flagpole, whereas triangles often involve deeper retracements.
- Pennants indicate trend continuation, while triangles may signal reversals or continuation.
- Pennants are short-term patterns, forming within one to three weeks, while triangles generally take longer to develop.
Trading Bullish and Bearish Pennants
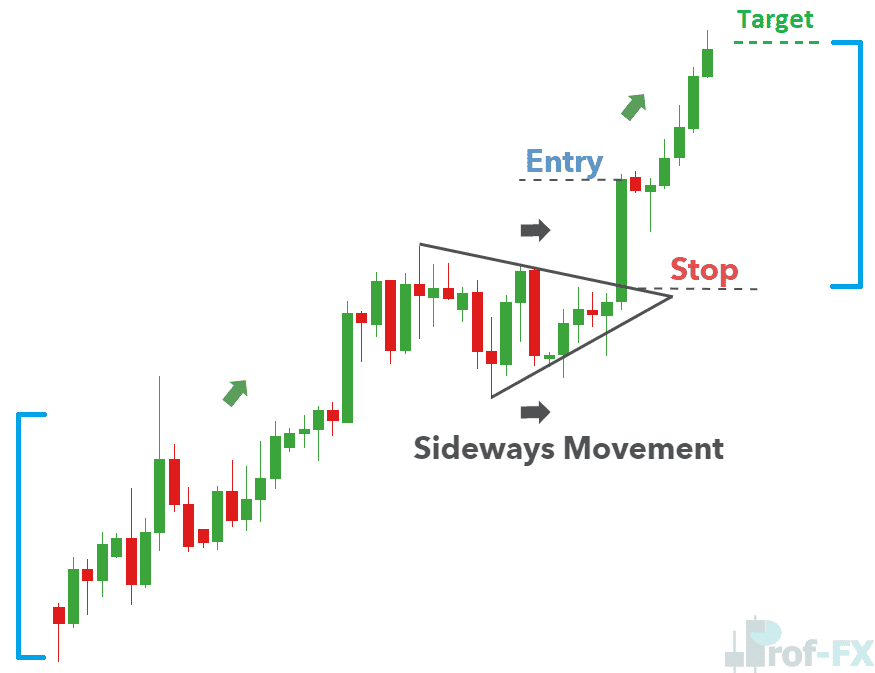
The trading strategy for Bullish and Bearish Pennants is similar, with the difference lying in the trade direction. Here’s an example using a Bullish Pennant in the GBP/NZD pair:
- Entry Point: Look for confirmation of the breakout after a sharp price move. A candlestick close above the Pennant signals the entry point for a long trade.
- Stop Loss: Place a stop loss below the breakout candle’s low or just beneath the Pennant for conservative risk management.
- Target Levels: Measure the distance from the flagpole’s start to the Pennant, then project this distance from the breakout point to determine potential profit targets.
Prudent risk management is crucial, as markets don’t always behave as expected. Trade only with capital you can afford to lose.
By mastering the nuances of Pennant patterns, traders can enhance their ability to spot high-probability trading opportunities. Whether bullish or bearish, these patterns provide clear signals that, when combined with sound risk management, can significantly boost trading success.


