


Trendline analysis is one of the most fundamental techniques in forex trading. It provides a structured and objective way to evaluate market direction, identify key support and resistance levels, and construct high-probability trade setups.
Although no single strategy guarantees consistent success, integrating trendline analysis into a broader trading system can significantly improve entry and exit precision, especially in trending market conditions.
The Importance of Trendlines in Trading
Trendlines are among the simplest yet most powerful tools available to traders. By connecting key highs or lows on a price chart, traders can determine the slope (or gradient) of the market.
This slope serves as a visual representation of trend direction:
- Upward slope → bullish trend
- Downward slope → bearish trend
More importantly, trendlines act as dynamic support and resistance levels, helping traders anticipate where price may react.
Example: Identifying Trend Direction Using Trendlines
On a daily chart of the U.S. Dollar Index (DXY), a rising trendline illustrates a sustained bullish trend. The consistent upward slope reflects higher lows, reinforcing positive market sentiment.
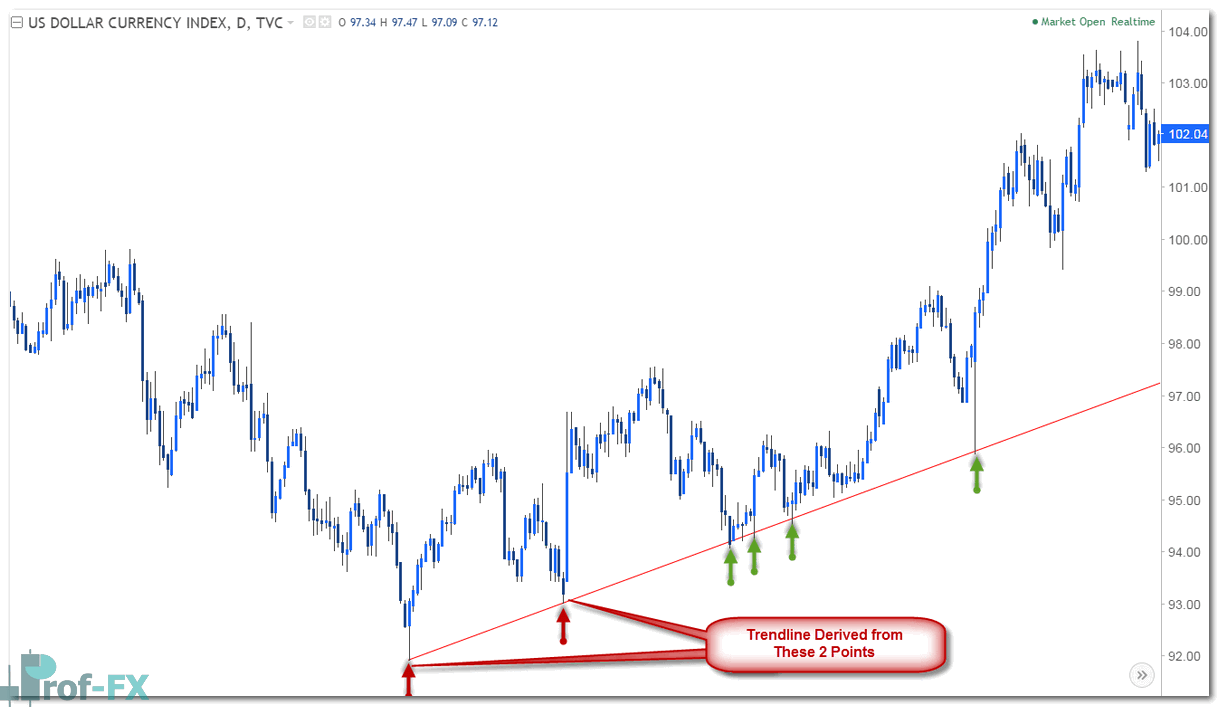
From a strategic perspective, the preferred approach in such a trend is to look for buy opportunities on pullbacks. Specifically, retracements toward the trendline support provide favorable entry points with defined risk.
Using Trendline Support for Trade Entries
When price pulls back toward an established trendline:
- The trendline acts as support
- Traders anticipate a continuation of the trend
- Entry is typically taken near the trendline
- Stop loss is placed below the support level
This approach aligns with trend-following principles and allows traders to enter trades at more advantageous price levels.
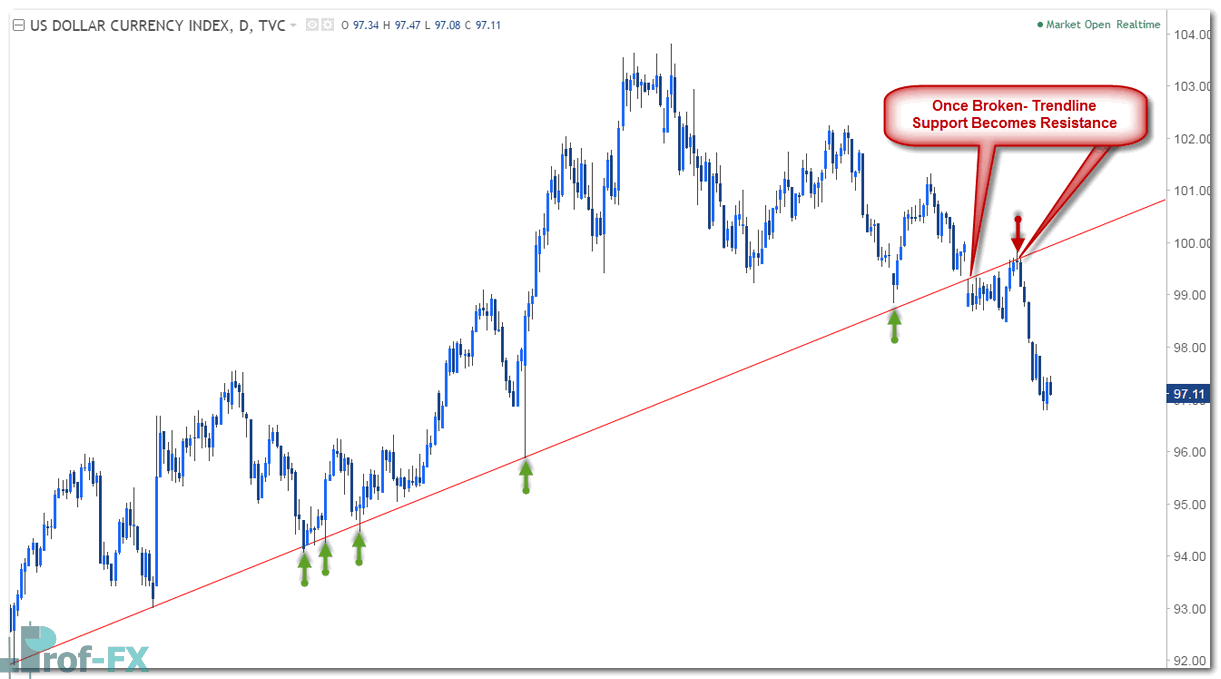
Trendline Breaks and Market Reversals
While trendlines often act as support or resistance, their break can signal a significant shift in market behavior.
When a trendline support is broken:
- The previous support becomes resistance
- Market sentiment may shift from bullish to bearish
- The break can indicate the start of a reversal or deeper correction
Similarly, when price breaks above a resistance trendline:
- The trendline may act as new support
- This can confirm a bullish breakout and continuation
Example: Trendline as Both Support and Resistance
The AUD/NZD example demonstrates how a single trendline can serve multiple roles over time.
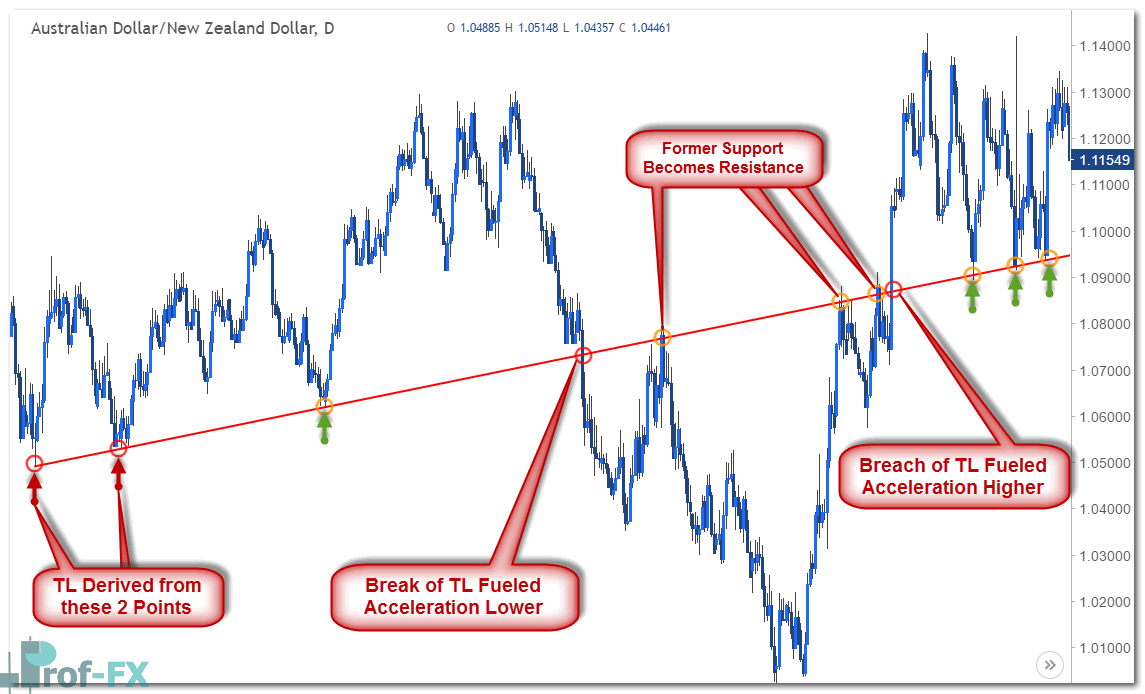
- Initially, the trendline acts as resistance
- After a breakout, it becomes support
- Subsequent retests confirm its validity
This behavior highlights a key principle: support and resistance levels are dynamic and can switch roles after a breakout.
Key Principles of Effective Trendline Analysis
1. Confirmation Requires Three Touchpoints
While two points are sufficient to draw a trendline, they are not enough to confirm its validity. The third touchpoint strengthens the reliability of the slope and increases confidence in its predictive value.
2. Evaluating a Valid Break
Traders should initially assume that a trendline will hold. However, confirming a breakout requires careful analysis:
- On higher time frames, a daily close beyond the trendline is often used as confirmation
- On lower time frames, price action becomes critical look for:
- Break
- Pullback
- Retest of the trendline as support/resistance
This sequence provides stronger validation of a genuine breakout.
3. Breakouts Should Show Momentum
A valid trendline break is typically followed by acceleration in the direction of the breakout.
If price breaks a trendline but fails to follow through, this may indicate a false breakout (false break or throw-over). Such scenarios often occur in mature trends and can precede reversals.
4. Avoid Chasing Breakouts
Entering trades immediately after a breakout increases risk.
A more disciplined approach is:
- Wait for a pullback to retest the trendline
- Enter after confirmation of support/resistance
- Place stop loss beyond the retest level
This method improves risk/reward and reduces exposure to false signals.
Strategic Perspective
Trendline analysis is not purely mechanical it involves a degree of subjectivity. However, this does not reduce its effectiveness. When applied consistently and combined with other tools such as price action, candlestick patterns, and multi-timeframe analysis, it becomes a powerful component of a professional trading strategy.
Final Conclusion
Trendlines provide a clear and adaptable framework for analyzing market trends and identifying trade opportunities. They help traders:
- Define market direction
- Locate key reaction zones
- Structure entries and exits with precision
In professional forex trading, trendlines are not optional, they are foundational. Traders who master their application gain a significant advantage in navigating trending markets and avoiding low-probability trades.


