


Many traders rely on chart analysis as a streamlined and practical method for identifying potential trading opportunities, with technical indicators playing a central role in this process. Among the most widely used tools in forex trading are the MACD (Moving Average Convergence/Divergence) and the Stochastic Oscillator, both of which are commonly applied to detect possible entry and exit signals under specific market conditions.
The purpose of this article is to objectively evaluate how each indicator can be used to identify trading signals in clearly defined scenarios, and how both indicators may be combined to improve timing precision and signal confirmation.
MACD vs Stochastic: Is One Indicator Better Than the Other?
In the EUR/USD chart below, a strong and prevailing upward trend is clearly visible on the price chart. When applying the MACD, the first crossover signal appears when the MACD line (blue line) crosses above the signal line (red line). This generates a bullish signal, indicating that both price direction and momentum are strengthening, which often suggests continuation of the existing bullish trend.
At the second MACD crossover, the MACD line moves below the signal line, generating a bearish signal. However, because this crossover still occurs above the zero line, it more accurately suggests that the bullish momentum is weakening, rather than signaling a full trend reversal. In other words, the broader market structure still remains in favor of buyers.
In both cases, the MACD crossover signals align closely with the actual price action visible on the chart during the same period. By contrast, under the same market conditions, the stochastic indicator produces less reliable signals, including false indications that may not accurately reflect the prevailing trend.
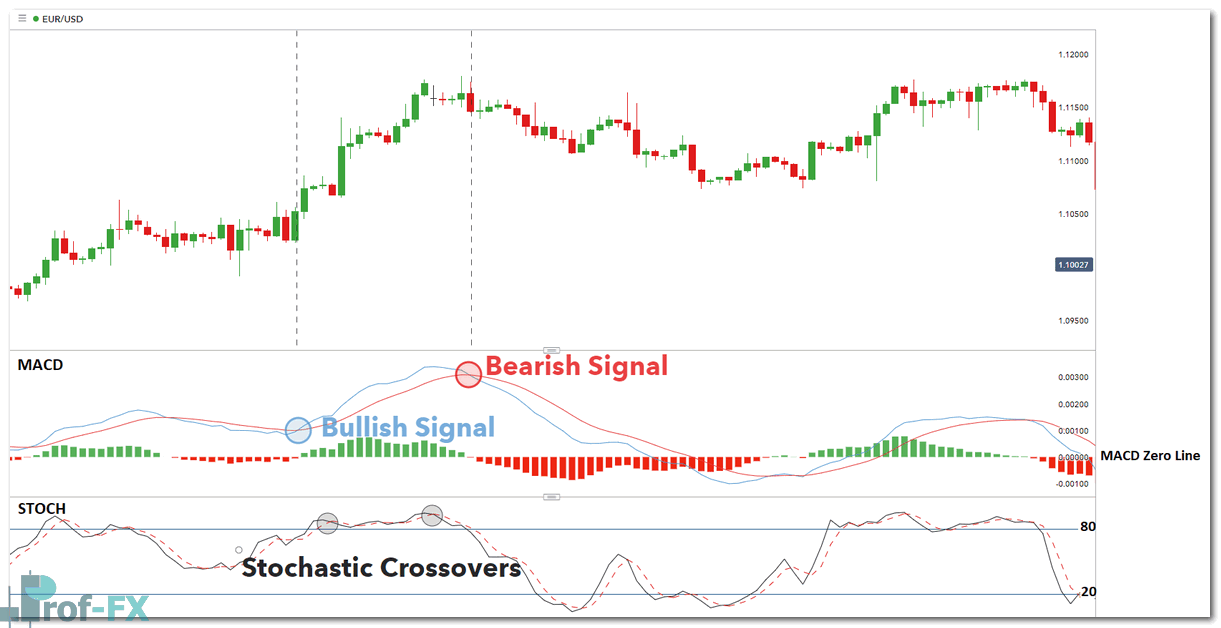
The example above demonstrates a trending market, where the MACD tends to perform effectively. However, the question then becomes: what happens when the market is ranging?
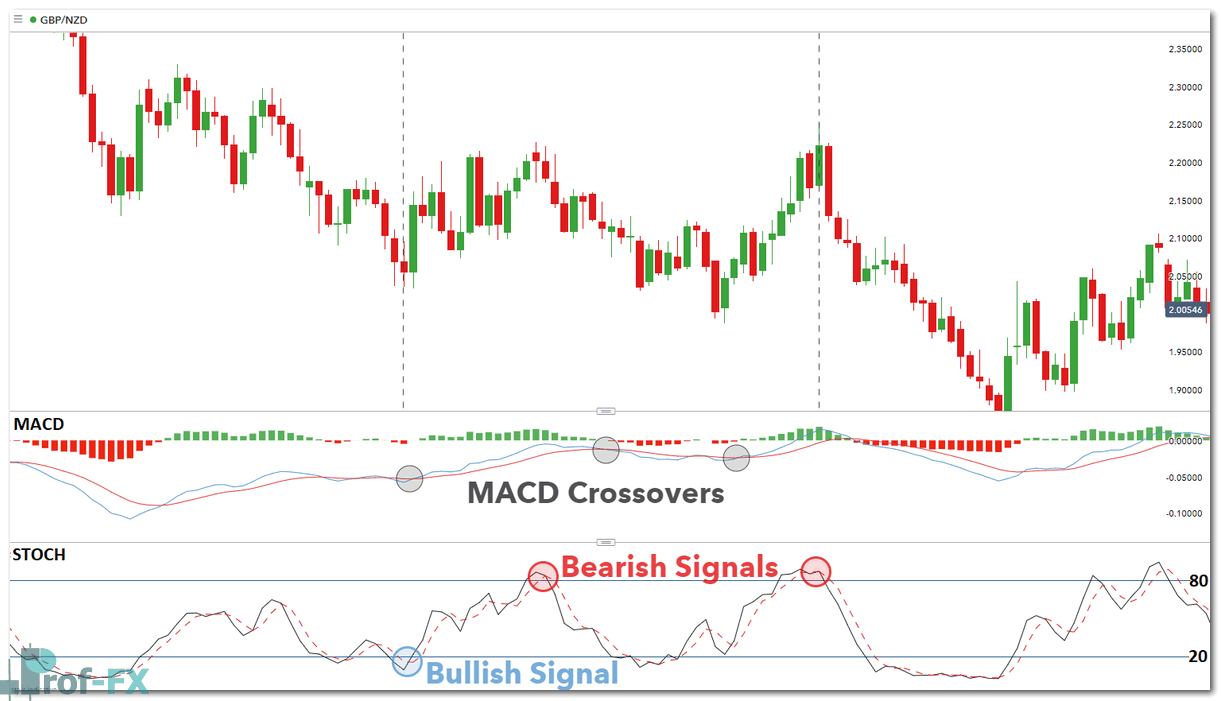
Looking at the next example below, where GBP/NZD is range-bound and trading sideways, the outcome is notably different. In this environment, the MACD provides less dependable signals, while the stochastic oscillator delivers clearer and more actionable entry and exit points.
With the stochastic indicator, a bullish signal is generated when the %K line (black line) crosses above the %D line (red dotted line). Conversely, a bearish signal occurs when the %K line crosses below the %D line.
The most reliable signals typically occur when:
- A bullish crossover happens while moving above the 20 level from below, and
- A bearish crossover occurs while moving below the 80 level from above
These levels are significant because they represent oversold and overbought conditions.
As shown below, the first stochastic crossover occurs below the 20 level, satisfying the criteria for a bullish signal. This indicates that GBP/NZD is oversold, suggesting that price may soon begin to rise.
Similarly, the second and third crossovers occur from above the 80 level, where the %K line crosses below the %D line. This signals that the market has entered an overbought condition, increasing the probability that prices may decline.
This example clearly illustrates that while the MACD signals are not necessarily wrong, the stochastic oscillator offers more precise and visually clearer entry and exit signals in ranging markets.
As demonstrated above, the MACD is generally more effective in trending market conditions, whereas the stochastic oscillator often performs better in sideways or range-bound markets. This distinction is widely recognized in professional trading analysis and should be taken into account when selecting indicators.
Next, we will examine how traders can combine both the MACD and stochastic indicators to obtain more refined and higher-probability trading signals.
A Double-Cross Strategy with Stochastic and MACD
When applying a double-cross strategy using both the stochastic and MACD, it is essential that the signal criteria for both indicators are satisfied before considering a potential trade setup.
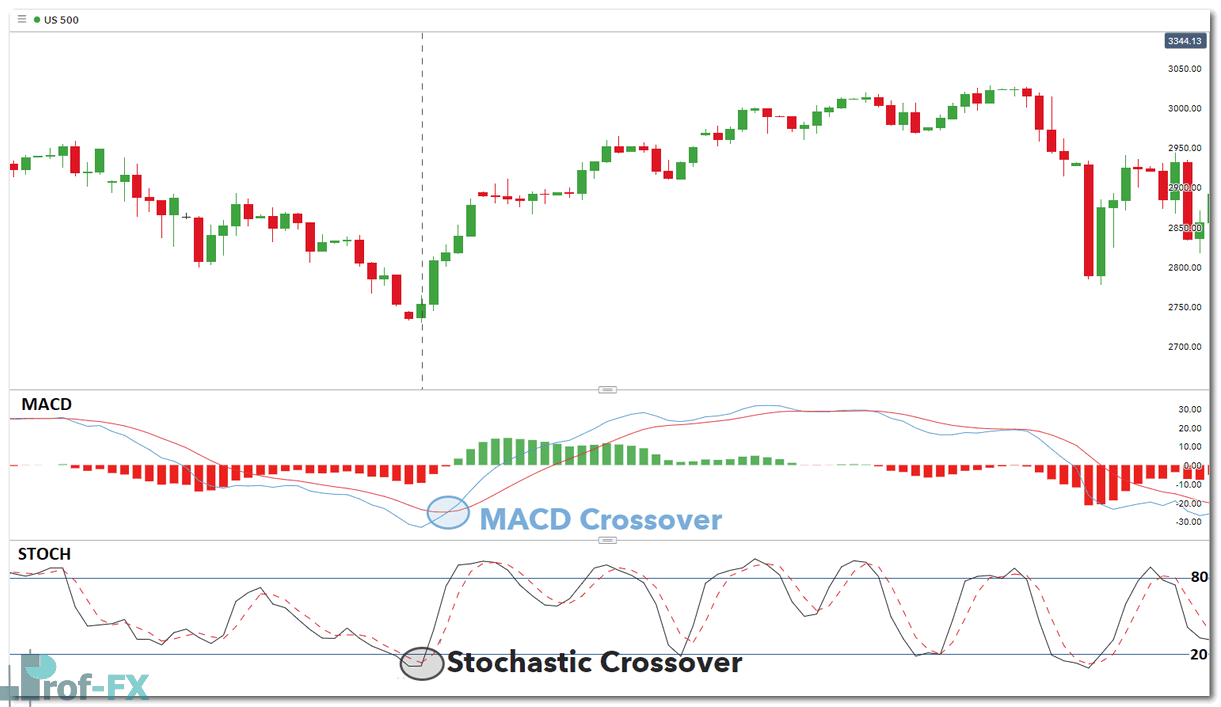
In the US 500 chart below, the first signal originates from the stochastic indicator, where the %K line crosses above the %D line while remaining below the 20 level. This is an important bullish indication, as it reflects a potential reversal from an oversold condition.
Shortly afterward, the MACD crossover occurs when the MACD line (blue line) crosses above the signal line (red line) while still positioned below the zero line.
This alignment creates a bullish confirmation from both indicators, strongly suggesting that an upward trend is beginning to form.
For this strategy to be applied correctly, the stochastic crossover should ideally occur shortly before the MACD crossover. If the sequence occurs in reverse, the setup may generate a false trend indication, reducing the quality of the signal.
This timing relationship is critical and is one of the key factors that experienced traders use to filter out low-probability entries.
When comparing MACD vs Stochastic, the more effective choice ultimately depends on the individual trader’s methodology, time horizon, and trading experience.
Factors such as:
- the time frame used
- the trader’s comfort and familiarity with the indicator
- and most importantly, prior success rates in real market conditions
will heavily influence whether one indicator is preferred over the other.
For some traders, the MACD may be the preferred tool for trend-following strategies, while others may favor the stochastic for range trading. More advanced traders often integrate both indicators simultaneously to strengthen confirmation and reduce false entries.
FAQ’s
Is There a Way to Reduce the Likelihood of False Signals?
Yes. One of the most effective ways to reduce the probability of false signals is through multiple time-frame analysis.
A trader can use a higher time frame to identify the dominant market trend and a lower time frame to pinpoint precise entry triggers.
A widely accepted and effective ratio is 4:1.
For example:
- Use a 4-hour chart to determine the primary trend direction
- Use a 1-hour chart to identify entry opportunities
This structured approach improves context and significantly increases signal reliability.
What Settings Should Be Used for the MACD and the Stochastic?
The default settings commonly used are:
- MACD: 12, 26, 9
- Stochastic: 5, 3, 3
However, adjusting the settings to longer periods may help generate more consistent and less noisy signals, particularly in volatile forex markets.
For example:
- MACD: 21, 55, 9
- Stochastic: 14, 3, 3
Longer settings often provide stronger confirmation and are frequently preferred by traders seeking to reduce short-term market noise.
More Forex Trading Resources
To gain deeper insight into the various technical indicators available in forex trading, read our article on technical indicators defined and explained.
Interested in trading forex but unsure where to start? Our beginner’s guide to forex trading and forex education courses may help build a strong foundation before entering live market conditions.
Prof FX provides forex news and professional technical analysis focused on the trends that influence the global currency markets.


