


What Is Price Action?
Price action refers to the study and analysis of market price movement over time. In forex trading, traders use price action to develop informed market opinions and make strategic decisions based on trend direction, key price levels, and appropriate risk management parameters.
At its core, price action helps traders understand how an instrument is behaving without relying exclusively on lagging indicators. It provides the foundation for evaluating market structure, momentum, support and resistance, breakout zones, retracement levels, and potential reversal points.
One of the most common starting points in price action trading is trend identification. In professional technical analysis, determining whether the market is bullish, bearish, or ranging is often the first step before applying any supporting indicators.
This is because virtually every other aspect of technical analysis requires a trend-based framework in order to generate meaningful trading insights.
Characteristic Price Action Chart
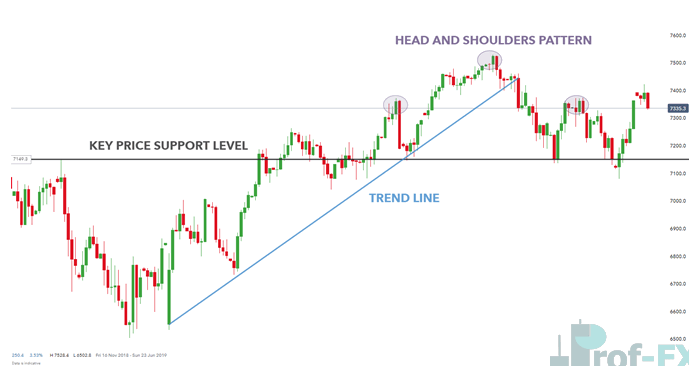
Price Action as Your First Indicator
Most technical analysis setups should begin with price action as the primary layer of evaluation.
The first principle every trader should understand is that technical indicators are functions derived from price action. In other words, indicators do not generate independent market information, they simply interpret historical price data through mathematical formulas.
For this reason, the indicator itself should never be treated as the ultimate decision-making tool. Instead, it should be viewed as a secondary confirmation mechanism that follows price action.
Price action is what ultimately governs the information an indicator displays on the chart.
As such, before consulting any indicator for an entry signal, a trader must first determine what price is doing, most importantly, the prevailing trend direction.
Once the trend has been clearly identified, the trader can then use an indicator to refine entry timing in the same direction as that trend.
Professional traders focus primarily on the movement of price itself, because trading outcomes are determined by price changes, not by changes in indicator values.
In practical terms, traders are not profiting from the RSI, Moving Average, or stochastic oscillator moving, they profit from the underlying currency pair moving in price.
This distinction is critical.
Some traders choose to base their entire analysis exclusively on price action, relying on candlestick structures, trendlines, support and resistance, breakout confirmations, and market momentum.
Others prefer a hybrid approach that combines price action with technical indicators, using indicators as a support system to improve decision accuracy.
Both methods can be effective, but in professional market analysis, price action remains the primary source of truth.
Technical indicators are ultimately derivatives of price action, meaning all signals they produce are based on prior price data.
These tools can provide valuable confirmation for:
- entry signals
- exit levels
- stop loss distance
- take profit targets
- trend confirmation
Trend identification also plays a vital role in broader market analysis, helping traders understand how the market is functioning from a holistic, timeframe-dependent perspective.
A trend visible on the 1-hour chart may differ significantly from the daily or weekly chart, which is why timeframe context is essential.
USD/ZAR Price Action Example
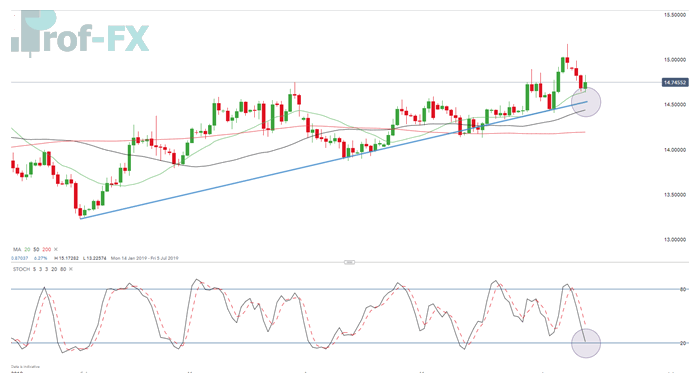
The USD/ZAR chart above demonstrates the strong symbiotic relationship between price action and technical indicators within a classic technical trade setup.
The structure of the setup begins with price action through the identification of an uptrend, represented by the blue trendline.
In this context, the trendline not only defines directional bias but also acts as a dynamic support level, which is often used by traders as a potential long-entry zone.
The addition of the Moving Average (MA) further strengthens this bullish bias.
In this example, price remains above the 20, 50, and 200 moving average lines, which provides additional confirmation that both the short-term and broader trend remain upward.
This alignment across multiple moving averages is widely regarded as a strong bullish confirmation signal in technical analysis.
Further confirmation comes from the stochastic oscillator, which suggests that the market is approaching oversold territory.
In an established uptrend, an oversold reading often signals a potential bullish retracement entry opportunity, indicating that upward momentum may soon resume.
From an execution standpoint, entry timing would require traders to closely monitor both:
- the stochastic oscillator
- the price movement as it approaches support
As price moves closer to the blue trendline support area, traders would typically look for confirmation through bullish candlestick behavior, rejection wicks, or momentum recovery.
Once price reaches and reacts positively from this level, traders may consider entering a long position, always supported by appropriate risk management, including clearly defined stop loss and take profit levels.
This approach reflects a disciplined trading methodology where price action establishes the setup and indicators provide tactical confirmation.
Price Action and Technical Indicators: A Summary
Price action is a comprehensive technical analysis method that supports a wide range of trading strategies used by professional forex traders.
It serves as the foundation for understanding:
- trend direction
- market momentum
- support and resistance
- breakout and retracement zones
- risk-to-reward positioning
Technical indicators are most effective when used in conjunction with price action, rather than as standalone signals.
When properly combined, this approach allows traders to formulate more accurate, objective, and higher-probability trade decisions.
The most effective technical setups typically begin with price, followed by indicator confirmation, not the other way around.
This hierarchy is what separates structured professional analysis from reactive retail trading.
Become a Better Trader with Our Trading Tips
If you are new to forex trading, consider exploring Forex for Beginners Trading Courses to build a stronger foundation in technical analysis, leverage, margin, trend trading, and risk management.
It is also essential to stay updated with major news events and economic releases, as macroeconomic developments can significantly impact currency volatility and trend behavior.
Using an economic calendar is highly recommended for monitoring scheduled events such as:
- Central bank interest rate decisions
- Inflation reports
- Employment data
- GDP releases
Successful trading ultimately requires more than technical knowledge alone. Consistent profitability depends on sound risk management, disciplined execution, and emotional control. Understanding how much capital to risk on each open trade is a critical part of long-term sustainability in forex trading.
We also strongly recommend reviewing professional Forex Education Trader guides to better understand the principles and habits that define consistently successful forex traders.


")