


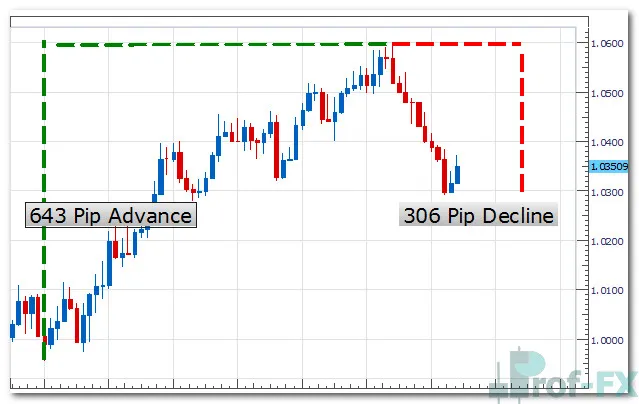
Finding the prevailing trend direction is one of the most essential—and often most challenging—tasks for any forex trader. Consider the AUDCAD daily chart as a starting point. After completing a 643-pip rally, the pair has reversed sharply, declining more than 306 pips from its June 7th high.
This naturally raises a critical question: Should a trader be looking to buy or sell currency pairs like AUDCAD in its current state? And more importantly, how can we confirm whether the trend has actually shifted?
To answer these questions, today we will examine a powerful trend-diagnostic tool used by many systematic and discretionary traders alike: the Aroon Indicator.
Understanding the Aroon Indicator: A Systematic Approach to Trend Strength
The Aroon indicator, developed by Tushar Chande, consists of two independent yet complementary components: Aroon Up and Aroon Down. Each oscillates between 0 and 100, offering traders a clear numerical measure of trend strength, direction, and potential momentum shifts in a currency pair.
Here’s how each component functions:
Aroon Down (typically shown in green)
- Measures the strength of a downtrend.
- Higher readings indicate that price has recently created new lows, suggesting increased bearish momentum.
Aroon Up (typically shown in red)
- Measures the strength of an uptrend.
- Higher readings show that price has recently printed new highs, signaling bullish momentum.
As both lines fluctuate within their respective range, traders observe crossovers to identify directional bias:
- When Aroon Down > Aroon Up, the market is considered to be in a downtrend.
- When Aroon Up > Aroon Down, the market is displaying bullish strength.
This simple but effective structure makes the Aroon indicator a valuable component in trend-following systems, breakout strategies, and momentum analysis across forex, commodities, indices, and even crypto markets.
Applying the Aroon Indicator to AUDCAD: A Shift Toward Bearish Momentum
Looking again at the AUDCAD daily chart—this time with the Aroon indicator applied—we can clearly observe a significant technical development. The Aroon Down line has crossed above the Aroon Up line, signaling a transition in market momentum.
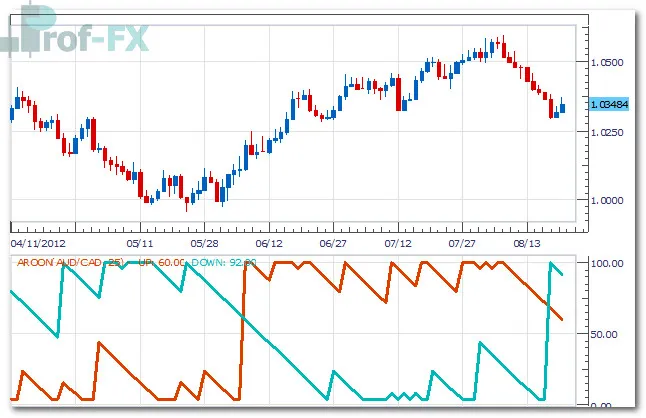
This crossover serves as a confirmation that bearish pressure is building, indicating that the pair may be establishing a new downward trend. From a trader’s perspective, this reinforces a bearish directional bias—suggesting that price may continue to move lower as long as Aroon Down maintains dominance.
However, this bias becomes invalid if:
- Aroon Up crosses back above Aroon Down, signaling a potential bullish shift or trend exhaustion.
For trend traders, confirmation from the Aroon indicator can be a catalyst to focus on bearish continuation setups, especially during periods of weakening commodity currencies or strengthening safe-haven flows—factors commonly influencing AUDCAD.
Trading Plan: Focusing on Bearish Breakouts as Long as Downward Momentum Holds
My professional bias remains bearish on AUDCAD as long as the Aroon Down line maintains its position above Aroon Up. One practical implementation of this bias is to monitor the market for bearish continuation patterns, including:
- Breakouts to fresh lower lows
- Retests of key support zones
- Momentum-aligned entries during periods of increased volatility
Based on the analysis, the current swing low is located at 1.0292. A breakout below this support could activate new downside potential, giving trend traders a logical price level for entry orders, especially in momentum-based strategies.
Alternate Scenario: When to Consider a Trend Reversal
While the bearish case currently dominates, traders should always prepare for alternate scenarios. If AUDCAD begins forming higher highs, this would likely coincide with:
- Aroon Up crossing above Aroon Down,
- A shift in trend structure,
- A potential transition into bullish momentum.
Should this occur, traders would be notified early through the indicator, allowing them to reassess their market bias and adapt positions accordingly.


