


")
The Relative Strength Index (RSI) is one of the most widely used indicators in technical analysis. It helps traders evaluate market momentum and identify potential overbought or oversold conditions. While RSI is not predictive, it provides a probabilistic framework that can enhance decision-making when applied within a structured trading strategy.
Understanding the Nature of Indicators
Technical indicators, including RSI, are derived from historical price data. In essence, they are refined interpretations of past price movements, similar in concept to moving averages.
Because of this, indicators do not forecast future price with certainty. Instead, they help traders:
- Interpret market conditions
- Identify potential opportunities
- Build strategies based on probability rather than prediction
From a professional standpoint, RSI should be viewed as a decision-support tool, not a standalone signal generator.
What Is RSI and How Does It Work?
The Relative Strength Index measures the strength or weakness of price over a specified number of periods.
- RSI values range from 0 to 100
- The calculation compares recent gains to recent losses
- The number of periods (e.g., 9, 14, 25) determines sensitivity
A shorter period (e.g., 9):
- Reacts quickly to price changes
- Produces more signals but with higher noise
A longer period (e.g., 25):
- Reacts more slowly
- Produces smoother, more reliable signals
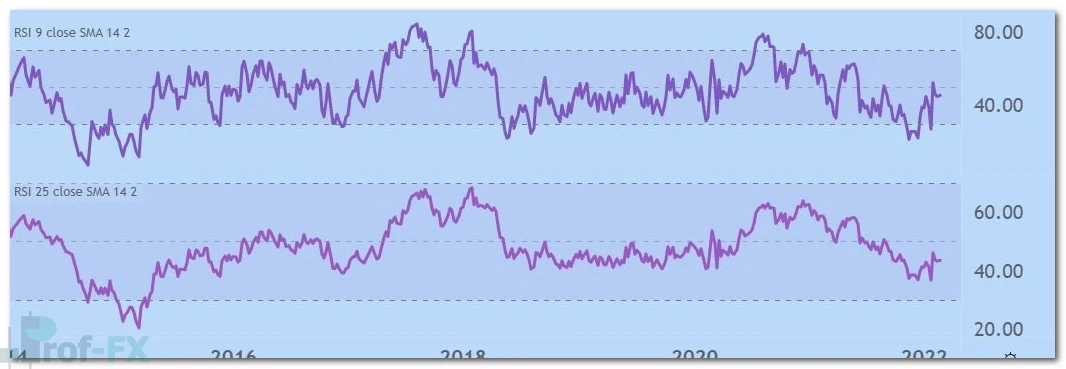
This difference highlights a key principle: faster indicators provide more signals, but slower indicators provide higher-quality signals.
Interpreting RSI Values
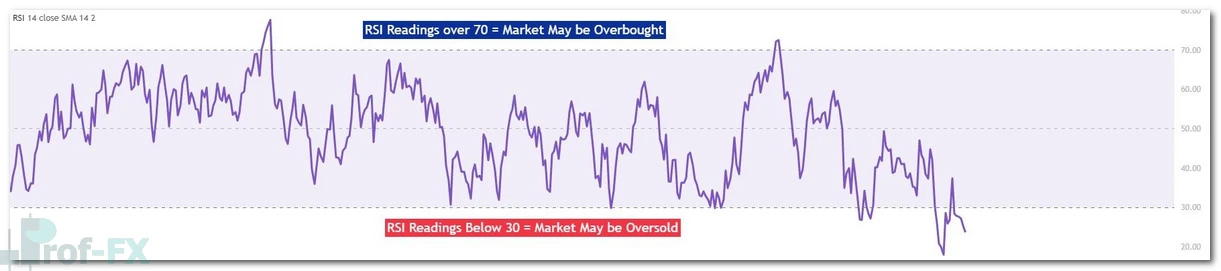
RSI is classified as an oscillator, meaning it fluctuates within a fixed range.
Key levels:
- Below 30 → Potentially oversold (weak price action)
- Above 70 → Potentially overbought (strong price action)
However, these conditions do not guarantee reversals. Markets can remain overbought or oversold for extended periods, especially during strong trends.
Therefore, RSI should be interpreted as:
- A measure of momentum extremes
- Not a definitive reversal signal
Basic RSI Trading Strategy
The most common approach to using RSI involves identifying potential reversals from extreme conditions.
Buy Setup (Bullish Signal)
- RSI crosses above 30
- Suggests price is moving out of oversold territory
- Indicates potential upward momentum
Sell Setup (Bearish Signal)
- RSI crosses below 70
- Suggests price is leaving overbought conditions
- Indicates potential downward movement
Example:
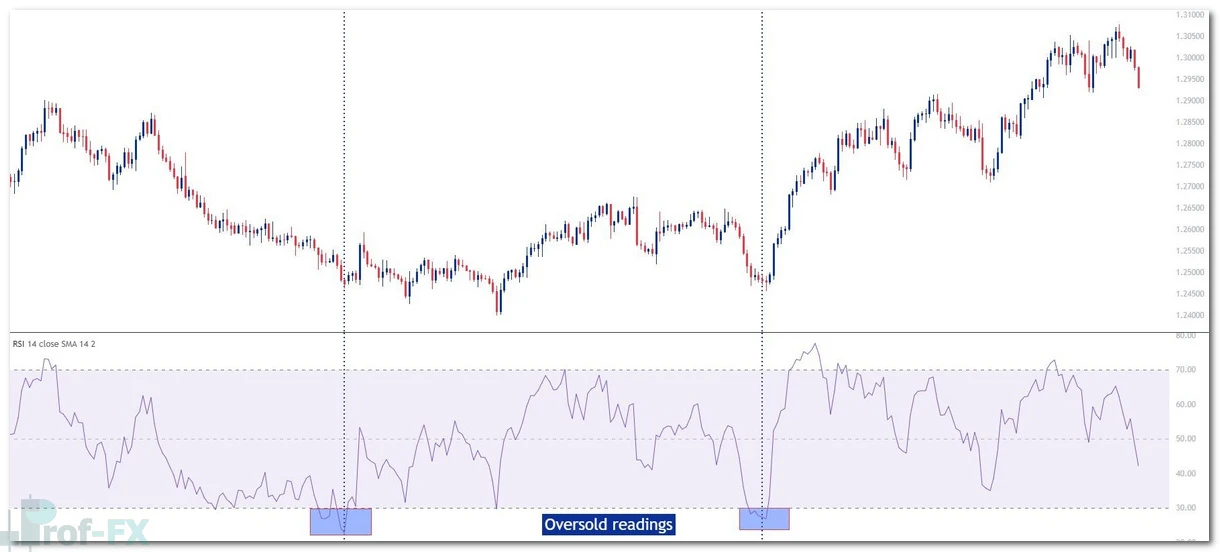
This approach is simple but must be applied with caution. It is most effective in range-bound markets, where price oscillates between support and resistance.
Using RSI in Range-Bound Markets
RSI performs best when the market lacks a strong trend.
In ranging conditions:
- RSI overbought → potential sell near resistance
- RSI oversold → potential buy near support
On multiple time frames, RSI can help identify repeated entry opportunities within these ranges.
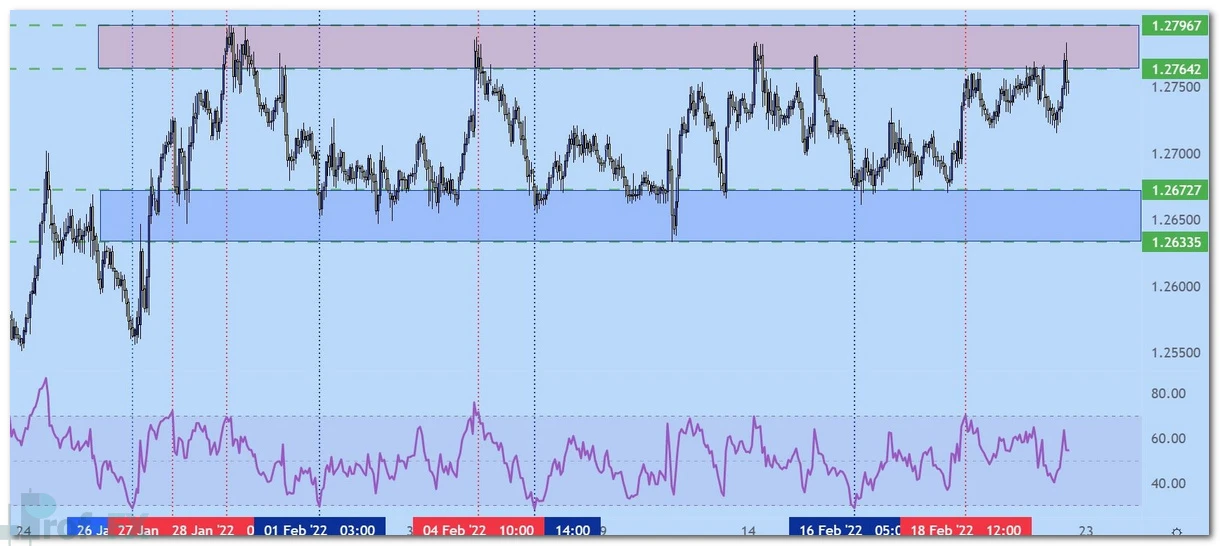
From a strategic perspective, combining RSI with horizontal support and resistance significantly improves accuracy.
Key Pitfalls of RSI Trading
Despite its popularity, RSI has inherent limitations that traders must understand.
1. Counter-Trend Nature
RSI signals often encourage traders to:
- Buy after price has been falling
- Sell after price has been rising
This means RSI is inherently a counter-trend indicator.
2. Poor Performance in Trending Markets
In strong trends:
- RSI may remain overbought or oversold for extended periods
- Traders entering against the trend may experience sustained losses
Example:
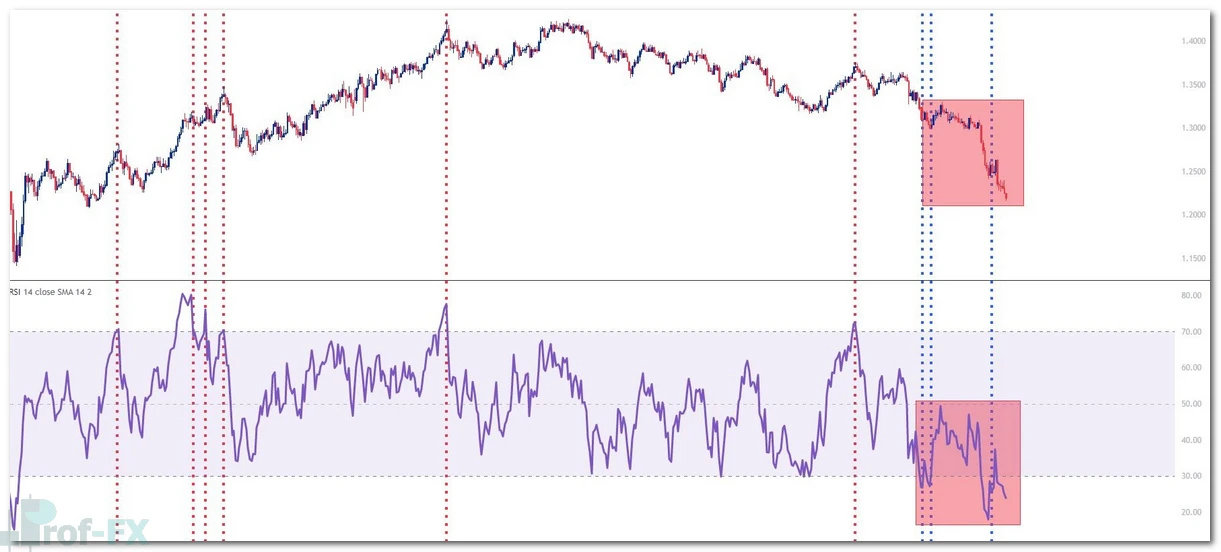
In a strong downtrend, multiple bullish RSI signals may appear, yet price continues to decline. This highlights the danger of relying solely on RSI without considering trend direction.
3. False Signals
RSI can generate frequent signals, especially with shorter periods. Without confirmation, many of these signals may lead to low-probability trades.
Best Practices for Using RSI
To improve effectiveness, traders should:
- Combine RSI with trend analysis (e.g., moving averages, trendlines)
- Use RSI primarily in range-bound conditions
- Confirm signals with price action or candlestick patterns
- Avoid trading against strong trends without additional confirmation
Strategic Perspective
RSI is most effective when integrated into a broader trading system. It excels at identifying momentum extremes but requires context to produce reliable signals.
Professional traders do not rely on RSI in isolation. Instead, they use it to:
- Refine entry timing
- Confirm market conditions
- Enhance risk management decisions
Final Perspective
The Relative Strength Index is a powerful tool for analyzing momentum and identifying potential reversal zones. However, its effectiveness depends entirely on how it is used.
In forex trading, RSI should not be treated as a predictive indicator, but as a probability-based framework. When combined with trend analysis, support and resistance, and disciplined risk management, RSI can significantly improve trade selection and execution.
Consistent profitability does not come from the indicator itself, but from how well it is integrated into a structured and rule-based trading strategy.


