


When approaching any trading scenario, the first crucial step is determining the best direction to trade a currency pair for the highest probability of success. Understanding market trends and identifying key levels is essential for making informed decisions.
Let’s explore an example using the 4-hour chart of GBPUSD to illustrate how we can apply trendlines for making trade entries.
At first glance, it’s clear that we’re looking for an opportunity to go long (buy). There are a few key reasons for this: the price action is above the 200 Simple Moving Average (SMA), and it has been pulling away from the SMA; the pair is forming higher highs and higher lows (as marked by the green lines), signaling an uptrend; and, at the time of the chart, the GBP was the strongest currency, while the USD was weaker.
Read also: 3 Ways To Use Moving Averages As Part Of Your Forex Trading Strategy
These factors together suggest a buying opportunity. But the question remains: when should we enter the trade?
Let’s take a deeper look at the trendline.
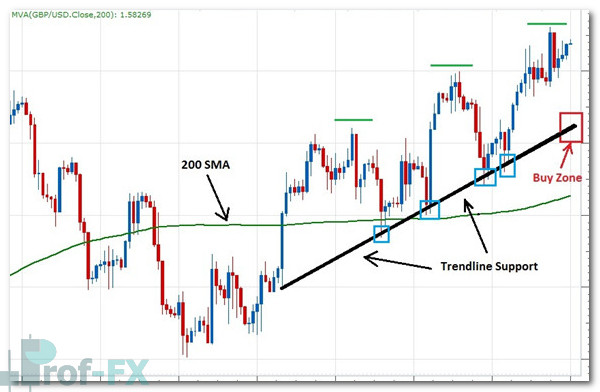
On this chart, we can see that price action has repeatedly touched the trendline support, indicated by the blue boxes. Since the price has tested this trendline at least three times, we can be confident that the trendline is valid.
Now, our entry strategy for buying this pair using trendline support is straightforward: we’ll wait for the price to dip back toward the trendline, entering what we call the “Buy Zone.” If the price reaches this zone and stalls—meaning a candle does not close below the trendline, just like in the blue box examples—we can enter a long position. We’ll place our stop just below the trendline or below the lowest wick that briefly touches the trendline.
Read also: How to Use Trend Line Support and Resistance for Identifying Buy and Sell Signals
As for exiting the trade, the trader could consider taking profits when the price hits resistance, reaches a previous high, or use a simple 1:2 Risk-Reward Ratio to lock in gains.
Let’s now shift our focus to a different example—the 4-hour chart of USDCHF—for selling against trendline resistance in a downtrend.
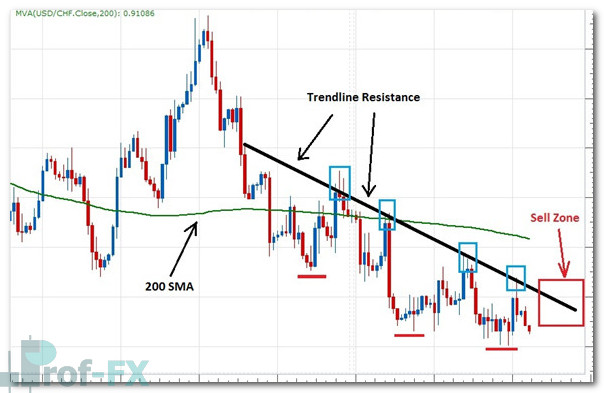
In this case, our approach is nearly the opposite of what we did in the GBPUSD example. Here, we’re looking to sell the pair, as it’s been consistently making lower lows (red lines) and lower highs. The price action is below the 200 SMA and continues to move away from it. Additionally, at the time of the chart, the USD was weak, and the CHF was strong.
Read also: Using Moving Average 200 Period to Conquer Forex Market
Once again, the price has tested the trendline resistance at several points, marked by the blue boxes. We can confidently say this trendline is valid. In this scenario, we would wait for the price to rise toward the trendline resistance, entering the “Sell Zone.” If a candle does not close above the trendline, we would enter a short (sell) position. The stop would be placed just above the trendline or above the highest wick that penetrates the trendline.
For exit points, the trader could close the trade if the price reaches the previous low, or, alternatively, use a 1:2 Risk-Reward Ratio to manage the position.
By applying trendline support and resistance in these ways, traders can make more informed, disciplined decisions in both uptrends and downtrends, maximizing the chances of success while managing risk effectively.


