


In the first part of our series on trading support and resistance, we explored the significance of these levels in forex. We learned how support and resistance levels can give us insights into market dynamics, such as supply and demand for a specific currency pair. In today’s article, we will take it a step further by focusing on how to use these levels to determine market trends and effectively time your entries.
Our main focus today will be on drawing trend lines on the chart. It’s important to note that drawing trend lines is more of an art than a precise science. You might place a trend line in a slightly different spot than I would, and that’s completely fine. The key is to identify two common points on the chart that will guide your line placement.
Identifying Buy Signals with SR Trendline
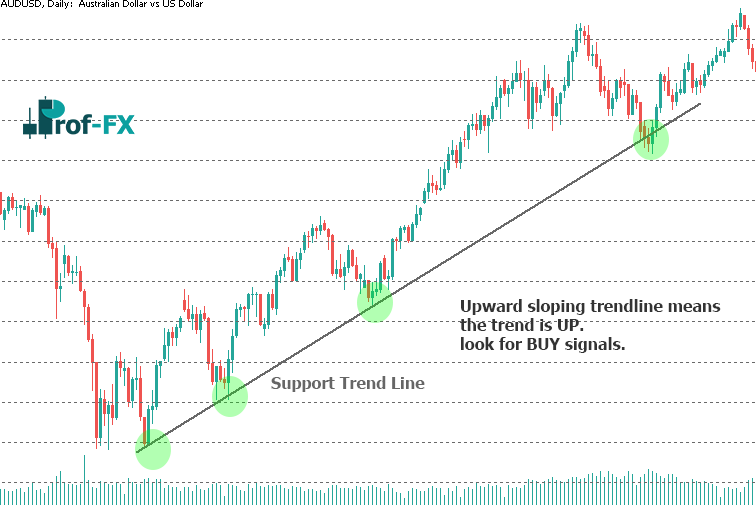
Take a look at this daily chart for the AUD/USD currency pair. Here, I’m simply connecting two low points marked by green circles. This forms an effective support trend line (also known as an upward trend line). The ideal place to draw this trend line is along the lows of the candle wicks. Once you’ve established this line, you gain two crucial pieces of information to help guide your trading decision:
- Since the trend line slopes upward, this indicates an upward market direction.
- You can use this trend line as a basis for generating buy signals in this pair.
When the market is in an uptrend, and the trend line has been drawn, a new long position can be entered when price action moves down to the support level and respects it. The key here is ensuring that the body of the candle does not close below the support line. Once the price touches the support and the candle closes above the line, this signals a valid buying opportunity.
Identifying Sell Signals
Now, let’s look at a daily chart for the USD/CHF. Here, we connect the common swing highs (marked with pink circles) to form a resistance trend line. In this example, the price has just touched the resistance line for the fourth time. A general rule of thumb is that the more times a trend line is touched, the weaker it becomes. This makes the best time to trade trend lines typically around the third or fourth touch.
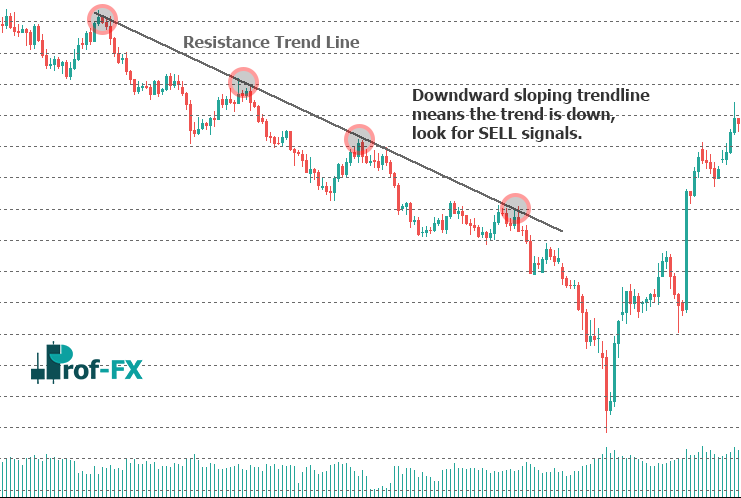
- Since this trend line slopes downward, it indicates a bearish market direction. Therefore, we will focus on identifying sell signals.
- This resistance trend line will help generate sell signals in this currency pair.
In a downtrend, once the resistance trend line is established, you can take a new sell position when the price action rises up to the resistance line and respects it. For a valid sell signal, ensure the candle body does not close above the resistance line. Once the price touches the resistance and the candle closes below it, that’s when a sell signal becomes valid.
By understanding how to properly draw trend lines and using them to identify buy and sell signals, you’re better equipped to navigate the forex market with more precision. Keep in mind that these signals are most effective when combined with other forms of analysis and sound risk management practices.


