


Crude oil remains one of the most liquid and actively traded commodities in global financial markets. High trading volume, strong market participation, and consistent volatility make oil particularly attractive for traders seeking dynamic opportunities across short-term and long-term market conditions.
Successful oil traders understand that crude oil prices are primarily driven by shifts in supply and demand. Monitoring these forces is essential because even relatively small disruptions can produce significant price fluctuations.
Both fundamental analysis and technical analysis play critical roles in crude oil trading. Traders who combine macroeconomic awareness with disciplined chart analysis are often better positioned to identify higher-probability opportunities and improve overall market efficiency.
Equally important, professional traders maintain risk-conscious trading strategies. Consistent application of risk management principles can improve long-term stability, protect trading capital, and support more disciplined decision-making under volatile market conditions.
Why Trade Crude Oil and How Does Crude Oil Trading Work?
Crude oil is the dominant energy source powering the global economy, which makes it one of the most important commodities traded worldwide. As a naturally occurring fossil fuel, crude oil can be refined into a wide range of essential products including gasoline (petrol), diesel, lubricants, waxes, and petrochemical materials used throughout modern industry.
Because global economies remain heavily dependent on energy consumption, crude oil demand remains consistently high. Oil markets therefore experience substantial trading volume and deep liquidity. For traders, this often translates into tighter spreads, recurring technical patterns, and strong price volatility that can create frequent trading opportunities.
Brent crude serves as the primary international benchmark for oil pricing, with nearly two-thirds of global oil contracts linked to Brent pricing structures. West Texas Intermediate (WTI), meanwhile, acts as the benchmark crude oil for the United States market. Compared with Brent, WTI is generally considered slightly lighter and sweeter due to its lower sulfur content and quality characteristics.
Crude Oil Trading Hours
WTI Trading Hours – CME Globex
Sunday – Friday: 6:00 p.m. – 5:00 p.m.
Includes a daily one-hour break from 5:00 p.m. to 6:00 p.m.
Brent Trading Hours – ICE
Sunday – Friday: 7:00 p.m. – 5:00 p.m.
Crude Oil Trading Basics: Understanding What Drives Price Movements
When trading crude oil, the primary focus always revolves around supply and demand dynamics. Whether markets are reacting to economic reports, geopolitical developments, production decisions, or unexpected disruptions, traders ultimately assess how these events may affect future supply availability or global consumption demand.
Because crude oil markets are highly sensitive to imbalance, even modest changes in expectations can trigger sharp price movements.
Supply Factors
Refinery Disruptions and Geopolitical Risks
Unexpected outages, infrastructure maintenance, or operational disruptions at major refineries and pipelines can materially influence global oil supply. Facilities such as the Forties pipeline system in the North Sea or the Port Arthur refinery in Texas are closely monitored by market participants because interruptions can tighten available supply and increase pricing pressure.
Geopolitical instability in major oil-producing regions also remains a major market driver. Conflict throughout the Middle East frequently generates concerns regarding potential supply shortages.
For example, during the outbreak of the Libyan Civil War in 2011, crude oil prices surged approximately 25% within only a few months as traders reacted to fears surrounding disrupted oil production and exports.
OPEC Production Decisions
The Organization of the Petroleum Exporting Countries (OPEC) plays a critical role in global oil pricing through coordinated production policies.
Production cuts, supply extensions, or output increases announced by OPEC and its allies can significantly affect market sentiment and price direction.
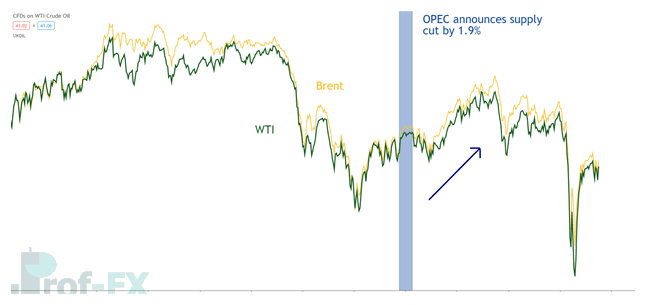
A major example occurred in 2016 when OPEC announced plans to reduce global oil supply by approximately 1.9%. Following the announcement, crude oil prices rallied substantially, climbing from roughly $44 per barrel to nearly $80 per barrel over time.
WTI and Brent Crude price reaction to OPEC supply cut:
Global Oil Suppliers
Understanding the world’s leading oil-producing nations is another important component of oil market analysis. Major suppliers have considerable influence over global production capacity and export stability.
Professional traders frequently monitor production reports and energy statistics released by institutions such as the Energy Information Administration (EIA) to evaluate changing market conditions and potential supply shifts.
Demand Factors
Seasonality
Seasonal demand patterns can strongly influence oil prices.
During hot summer periods, increased travel activity and higher energy usage often contribute to stronger oil consumption. Conversely, colder winter conditions can increase demand for heating fuels and related petroleum products as households and businesses consume more energy.
These recurring seasonal trends are important considerations within many crude oil trading strategies.
Major Oil Consumers
Historically, developed economies such as the United States and European nations represented the largest global consumers of crude oil. However, recent decades have seen substantial growth in oil demand across Asian economies, particularly China and Japan.
Because of this shift, traders must closely monitor economic performance and industrial activity within these nations. Any slowdown in economic growth or manufacturing output may reduce oil demand and place downward pressure on prices.
Correlation to Global Economic Growth
Crude oil prices generally maintain a positive correlation with global economic growth. Strong economic activity typically increases industrial production, transportation demand, and energy consumption, all of which support higher oil prices.
The United States and China, as the world’s two largest economies, serve as particularly important indicators of global growth expectations.
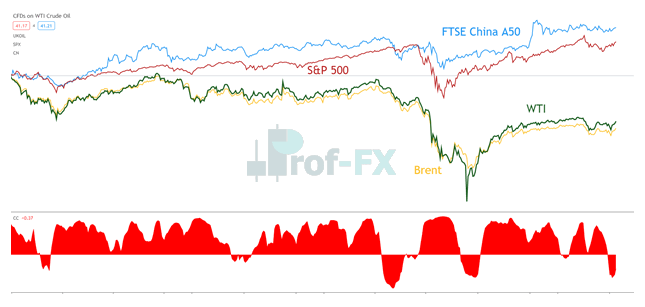
Major stock market indices tied to these economies often move in alignment with crude oil prices. In many cases, when equity indices weaken sharply, crude oil prices also decline due to concerns surrounding slowing economic activity. Conversely, strengthening equity markets often support bullish oil sentiment.
WTI and Brent Crude positive correlation with FTSE China A50 and S&P 500 chart representation:
Alternative Energy and Sustainability Trends
Although fossil fuels continue to dominate global energy consumption, the worldwide push toward renewable energy and sustainability remains an increasingly important long-term factor for crude oil markets.
Governments, corporations, and institutions continue investing heavily in cleaner energy technologies, electric vehicles, and renewable infrastructure. Over time, this transition may influence long-term oil demand expectations and reshape traditional pricing dynamics.
For this reason, traders should continue monitoring developments within the renewable energy sector as part of a broader crude oil trading strategy.
The Influence of Derivatives on Oil Pricing
Many analysts and market participants believe that the rapid expansion of oil derivatives markets has influenced traditional valuation models for crude oil.
Critics argue that oil futures markets may sometimes amplify speculative noise beyond what underlying fundamental conditions justify. In other words, short-term futures activity can occasionally produce price swings that appear disconnected from immediate supply-and-demand realities.
This remains a debated topic within the investment community. Nevertheless, it is increasingly clear that large speculative participants and institutional traders now exert considerable influence over oil market volatility through the growing derivatives landscape.
Want to explore the oil market further? Discover 8 Surprising Crude Oil Facts Every Trader Should Know!
How to Trade Oil: Top Tips and Strategies
Professional oil traders typically operate with clearly defined trading strategies rather than relying on emotional decision-making.
Experienced traders understand the core fundamental drivers affecting crude oil prices and apply strategies aligned with their trading objectives, market outlook, and risk tolerance.
No two trading strategies are identical. However, consistent profitability often depends on disciplined execution, responsible leverage usage, and avoidance of common trading mistakes that can erode long-term performance.
An effective crude oil trading strategy commonly includes the following components:
- Fundamental Analysis
- Technical Analysis
- Risk Management
Once traders understand the supply-and-demand fundamentals driving oil prices, they can use technical analysis to identify favorable market entries and exits. After technical signals are confirmed, traders can then apply proper risk management principles to structure the trade effectively.
Below is an example illustrating how these three components work together.
1. Fundamental Analysis
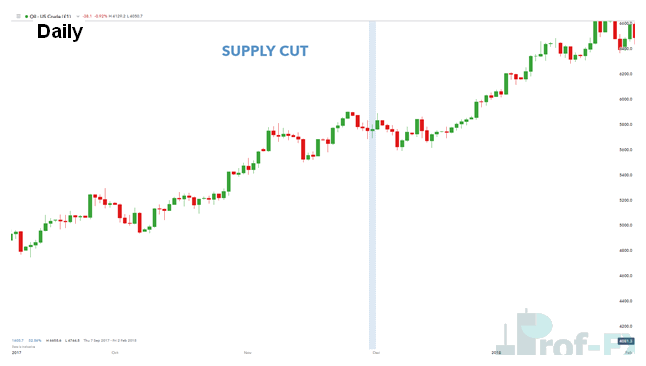
On November 30, 2017, OPEC and Russia agreed to extend oil production cuts, reducing overall supply levels in global markets.
According to basic supply-and-demand theory, declining supply combined with stable or rising demand tends to support higher prices. This fundamental development provided traders with a bullish macroeconomic outlook and established a basis for identifying potential buy opportunities.
WTI daily chart highlighting supply cut:
2. Technical Analysis
After identifying the bullish fundamental backdrop, the next step involves analyzing price action through technical analysis.
There are numerous indicators and charting methods available to traders. However, successful trading does not require excessive complexity. In many cases, one well-understood indicator combined with disciplined price analysis can be highly effective.
A common and reliable starting point is identifying the broader market trend.
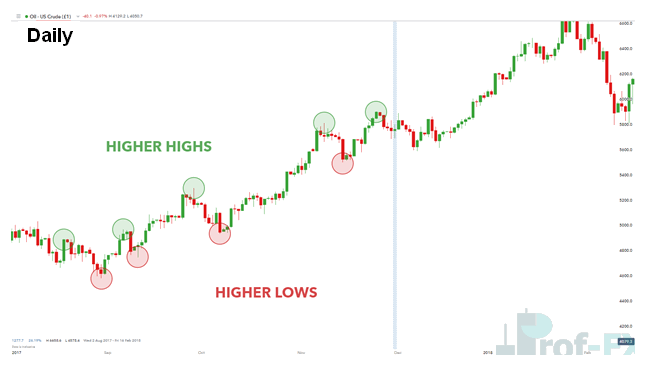
In this example, simple price action analysis revealed a pattern of higher highs and higher lows, indicating a developing bullish trend. This technical structure aligned with the bullish expectations generated by the earlier OPEC supply reduction announcement.
WTI daily chart showing preceding uptrend:
Once the bullish trend was confirmed, the next objective was identifying a suitable market entry.
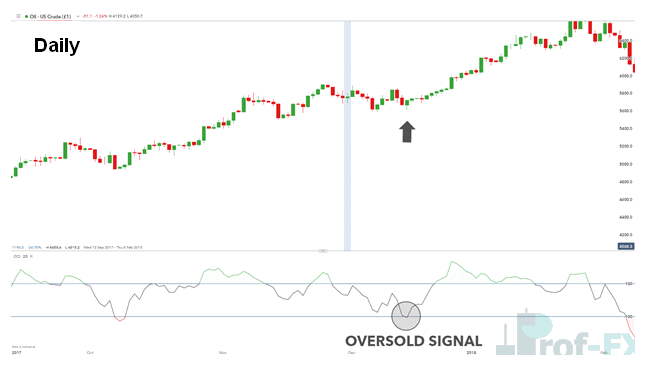
While traders may use different techniques to locate entries, this example incorporates the Commodity Channel Index (CCI) indicator. Shortly after the supply-cut announcement, the CCI entered oversold territory, signaling the possibility of renewed bullish momentum.
An oversold CCI reading supported the case for additional price appreciation and strengthened the rationale for entering a long (buy) position.
WTI daily chart with CCI indicator:
3. Risk Management
The final component of any professional trading strategy is risk management.
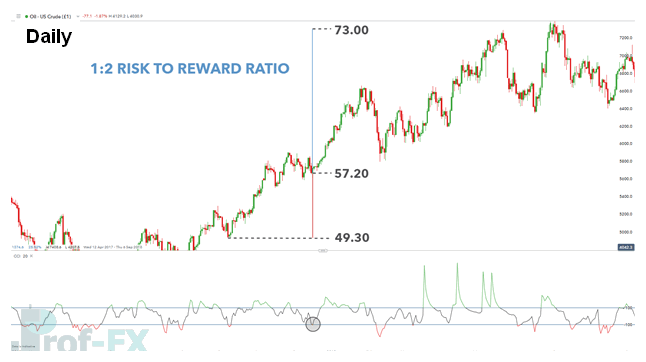
At Prof FX, we support the 1:2 risk-to-reward ratio guideline. In practical terms, this means traders should generally target potential reward levels approximately twice the size of their risk exposure.
To manage trade risk effectively, traders may place take profit levels above recent resistance while positioning stop loss orders below meaningful support zones.
In this example, a recent swing low near $49.30 acted as the stop loss reference point, approximately $8 below the entry price of $57.20.
Since no immediate resistance high existed for direct targeting, traders could project potential upside using basic risk-to-reward calculations. With an $8 stop distance, applying a 1:2 ratio projected an initial resistance target near the $73 level.
WTI daily chart with 1:2 risk-reward ratio:
This example demonstrates the importance of maintaining a positive risk-to-reward structure.
After researching thousands of live trades across multiple financial markets, we found that positive risk-to-reward ratios consistently represented a key characteristic among more disciplined and successful traders.
Additionally, Prof FX recommends risking less than 5% of total trading capital across all open positions.
Advanced Tips for Oil Trading
Experienced traders often incorporate additional market data and institutional indicators when building more advanced oil trading strategies.
These may include futures curve analysis, CFTC speculative positioning data, and options strategies designed to benefit from volatility or hedge existing exposure.
Futures Curve Analysis
The shape of the futures curve is highly important for commodity traders, hedgers, and institutional participants.
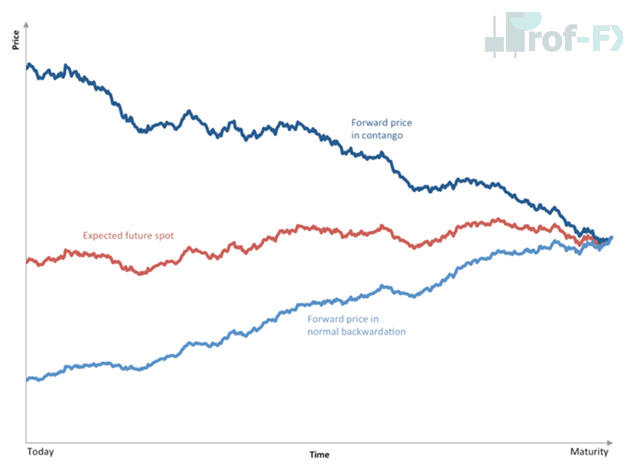
When evaluating the futures curve, traders generally focus on whether the market is in contango or backwardation.
Contango
Contango occurs when futures prices trade above the expected spot price. This reflects a market where participants are willing to pay more for future delivery than current pricing levels.
Contango is typically viewed as a bearish market structure because it may indicate expectations for weaker future demand or excess supply.
Backwardation
Backwardation occurs when spot prices trade above futures prices.
This structure is generally considered bullish because it often reflects strong current demand or tighter near-term supply conditions.
CFTC and Speculative Positioning
The Commodity Futures Trading Commission (CFTC) report is another valuable resource for oil traders.
CFTC positioning data provides insight into broader market sentiment and speculative activity. In many cases, movements in managed money net positioning can precede significant moves in crude oil prices.
Monitoring institutional positioning can therefore help traders better understand prevailing market dynamics and directional bias.
Trading Oil Through Futures and Options
Traders who choose to trade oil futures and options must use the appropriate exchange associated with the specific oil benchmark being traded.
Because many futures exchanges have strict participation requirements, the majority of direct futures speculation is conducted by professional traders and institutional participants.
Oil Investing Through Stocks and ETFs
Rather than trading oil directly, investors can gain exposure to crude oil markets through energy-sector stocks or oil-related Exchange Traded Funds (ETFs).
The performance of many energy companies and oil-focused ETFs is heavily influenced by fluctuations in crude oil prices.
Major Oil and Energy ETFs
- Energy Select Sector SPDR (XLE)
- Vanguard Energy ETF (VDE)
- United States Energy Fund (USO)
Key Reports Every Oil Trader Should Monitor
Weekly updates regarding US crude oil inventories represent some of the most important data releases for oil traders because they frequently trigger substantial volatility.
Inventory data serves as a critical indicator of supply-and-demand balance within energy markets.
For example, rising inventories may suggest weakening demand or excessive supply, while falling inventories often indicate stronger demand relative to supply availability.
American Petroleum Institute (API)
The American Petroleum Institute releases a weekly statistical report covering major petroleum products responsible for more than 80% of refinery production, including crude oil inventory data.
This report is typically released every Tuesday at 16:30 ET / 21:30 London time.
Department of Energy (DoE/EIA)
Similar to the API report, the Department of Energy and Energy Information Administration (DoE/EIA) reports provide detailed information regarding oil supply levels, crude oil inventories, and refined product data.
These figures are released every Wednesday at 10:30 ET / 15:30 London time.
Prof FX provides forex news, commodity analysis, and technical insights covering the major trends influencing global financial markets.


