


Harami Candlestick and Reversal Patterns: Key Insights
Reversal patterns are a core component of technical trading, enabling traders to capitalize on shifts in market direction. Among these, the Harami candlestick pattern stands out due to its clarity and ability to identify potential turning points with relatively tight risk exposure.
The Harami pattern provides traders with a structured way to determine directional bias and define precise risk levels. When applied correctly, it can significantly enhance timing and overall trade efficiency.
Understanding the Role of Reversal Patterns
Candlestick patterns are broadly categorized into:
- Continuation patterns, which suggest the prevailing trend is likely to persist
- Reversal patterns, which indicate a potential shift in market direction
Reversal patterns are particularly valuable because they signal when the underlying sentiment driving a trend may be weakening or ending. These patterns reflect the interaction between buyers and sellers, offering insight into changing market dynamics.
Recognizing formations like the Harami allows traders to anticipate and act on these transitions with greater confidence and structure.
What Is the Harami Candlestick Pattern?
The Harami is a two-candle reversal pattern that reflects a slowdown in momentum within an existing trend.
Its structure consists of:
- A large initial candle that aligns with the current trend
- A smaller second candle (often resembling a Doji or small-bodied candle) that forms within the range of the first
The name “Harami,” meaning “pregnant” in Japanese, describes this visual formation – the smaller candle appears contained within the larger one.
This structure indicates that the strong momentum of the first candle is weakening, creating conditions for a potential reversal. However, confirmation is required from subsequent price action.
Why Traders Use the Harami for Reversals
The Harami pattern is widely used because it allows traders to:
- Enter trades near potential turning points
- Define tight stop loss levels
- Achieve favorable risk/reward ratios
From a professional perspective, the value of the Harami lies in its ability to highlight momentum exhaustion, rather than providing a standalone entry signal.
The Supporting Role of the Doji Candle
The Harami pattern is closely related to the Doji candlestick, which often represents indecision in the market.
A Doji forms when:
- The open and close prices are nearly equal
- Upper and lower wicks extend from a small body
This reflects a balance between buyers and sellers, often preceding a reversal.
However, the Doji alone does not confirm direction. Traders must analyze:
- The following candle for confirmation
- Market conditions using indicators such as oscillators or moving averages
This approach ensures that the pattern is aligned with broader market context rather than being interpreted in isolation.
How to Trade the Harami Pattern
Effective use of the Harami requires combining Japanese candlestick analysis with trend context and confirmation signals.
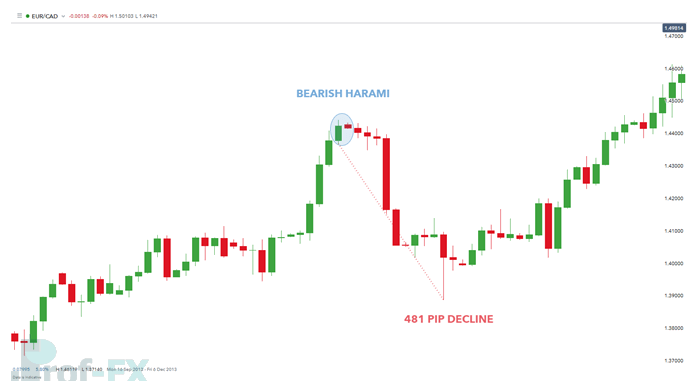
Bearish Harami Example
In a typical bearish Harami scenario:
- The market is in an established uptrend
- A large bullish candle is followed by a smaller candle within its range
- This signals weakening bullish momentum
Once confirmed by a subsequent bearish move, traders may:
- Exit existing long positions (take profit)
- Enter short positions targeting a reversal
In the example of the EUR/CAD pair, the formation of a bearish Harami marked a local top, followed by a substantial decline of over 400 pips. This demonstrates the pattern’s effectiveness when aligned with broader market structure.
Read: What Are Pips in Forex Trading?
Trade Execution and Risk Management
When incorporating the Harami into a trading strategy:
- Entry: After confirmation from the next candle (e.g., bearish close for a bearish Harami)
- Stop Loss: Typically placed above/below the high/low of the pattern
- Take Profit: Based on key support/resistance levels or predefined risk/reward ratios
Maintaining a structured approach ensures that trades remain consistent and aligned with overall strategy objectives.
Importance of Trade Journaling
Integrating new patterns like the Harami into a trading system requires performance tracking.
A trading journal allows traders to:
- Evaluate the effectiveness of the pattern over time
- Identify strengths and weaknesses in execution
- Refine strategies based on real performance data
From a professional standpoint, journaling is not optional, it is a critical tool for long-term consistency and improvement.
Enhancing Harami Effectiveness with Technical Confluence
The reliability of the Harami pattern improves significantly when combined with:
- Support and resistance levels
- Overbought/oversold conditions (oscillators)
- Trend analysis (moving averages)
This multi-factor confirmation approach reduces false signals and increases the probability of successful trades.
Final Perspective
The Harami candlestick pattern is a powerful indicator of potential market reversals, but its true value lies in context and confirmation. It reflects a transition in market sentiment specifically a weakening of the prevailing trend.
Professional traders do not rely on the Harami as a standalone signal. Instead, they integrate it into a broader, rule-based trading system that includes price action analysis, risk management, and performance tracking.
In forex trading, consistent success is achieved by combining patterns like the Harami with disciplined execution and data-driven decision-making, not by relying on any single signal in isolation.

")


