


One of the most common – and most important – questions traders ask is how to recognize when a market trend is changing. While the question itself is simple, the answer is anything but. Trend changes in forex are rarely clear-cut, and they almost never appear as a single, obvious signal. There is no black-and-white rule that applies perfectly in every market condition.
Instead, identifying a trend change is a probability-based process, built from multiple clues that gradually suggest momentum is shifting. Let’s walk through this concept step by step using a real market example and a professional framework that traders can apply consistently.
Understanding the Trend: AUD/USD Daily Chart Example
Let’s begin by examining the daily chart of the AUD/USD currency pair.
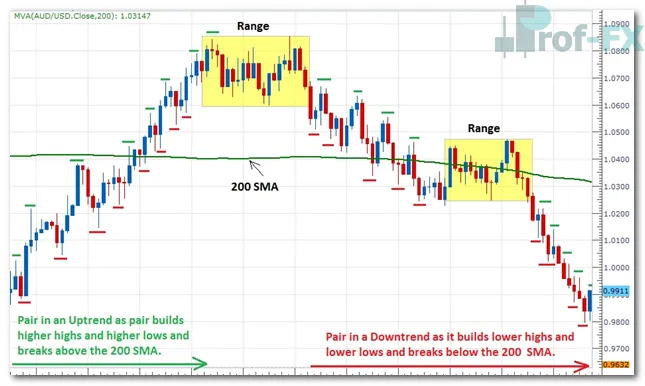
The uptrend shown on this chart began around December 15. From that point forward, price displayed the classic characteristics of a bullish trend:
- A sequence of higher highs and higher lows
- A decisive break above the 200 Simple Moving Average (SMA)
- Strong relative performance of the Australian dollar (AUD) versus a weak US dollar (USD)
This bullish move lasted roughly two and a half months, covering close to 1,000 pips, and reached its peak on February 29. By any professional standard, this was a well-defined and sustained uptrend.
When an Uptrend Begins to Stall
After a strong trend reaches maturity, price often does not reverse immediately. Instead, the market frequently enters a consolidation phase, where price moves sideways and volatility contracts.
In this example, that pause is clearly visible in the yellow rectangle on the chart. During this phase:
- Momentum slows
- Buyers and sellers reach temporary equilibrium
- The market “waits” for new information or conviction
From a hindsight perspective, we can see that when price eventually broke out of this consolidation to the downside, it marked the official start of the downtrend.
However, it is critical to understand this point:
No trader knew with certainty at the time that this was the exact moment the trend had changed.
This is why trend changes must be approached probabilistically, not emotionally or reactively.
Reverse Engineering a Trend Change
To identify a trend reversal, it helps to reverse engineer the prior trend.
An uptrend is defined by:
- Higher highs
- Higher lows
Logically, a downtrend is defined by the opposite:
- Lower highs
- Lower lows
On the right-hand side of the chart, we begin to see this bearish structure forming. As price repeatedly fails to make new highs and continues to push lower, the probability of a sustained downtrend increases.
At the same time, relative currency strength shifts:
- The AUD becomes progressively weaker
- The USD becomes progressively stronger
This alignment between price structure and fundamental currency strength adds weight to the trend change narrative.
Three Key Factors That Signal a Potential Trend Change
Rather than relying on a single signal, professional traders monitor multiple areas of evidence to assess whether a trend is losing momentum and potentially reversing.
1. Market Structure: Highs, Lows, and Support Levels
If price continues to:
- Form lower highs and lower lows
- Break through previous support levels
then the market is actively building a downtrend. The longer this behavior persists, the more credible the trend change becomes.
There is no universal time requirement. Aggressive traders may recognize the shift early and enter sooner, while conservative traders prefer more confirmation before committing capital.
2. Relationship to the 200 Simple Moving Average
The 200 SMA is one of the most widely respected long-term trend indicators in forex trading.
As price moves closer to the 200 SMA from above, the likelihood of a trend change increases. When price:
- Trades through the 200 SMA
- And closes below it
this provides strong technical evidence that bullish momentum has faded and a bearish trend may be taking control.
While not infallible, this signal carries significant weight among institutional and retail traders alike.
3. Shifts in Relative Currency Strength
Trends in forex are driven not just by charts, but by relative strength between currencies.
If the currency that previously led the trend:
- Loses strength consistently
- Becomes weaker relative to its counterpart
and this shift persists over time, it strongly supports the idea that the trend is changing. When price action and currency strength align, the probability of a genuine trend reversal increases substantially.
Putting It All Together
Calling a trend change with absolute certainty is impossible—especially in the short term. However, by monitoring:
- Market structure (highs, lows, and support)
- Price behavior around the 200 SMA
- Ongoing shifts in relative currency strength
traders can make informed, probability-based assessments about whether a trend is continuing, stalling, or reversing.
This disciplined approach helps traders avoid premature entries while also preventing them from clinging too long to a trend that is clearly losing momentum. Over time, learning to recognize these clues consistently is a key step toward trading with greater confidence, patience, and professionalism in the forex market.


