


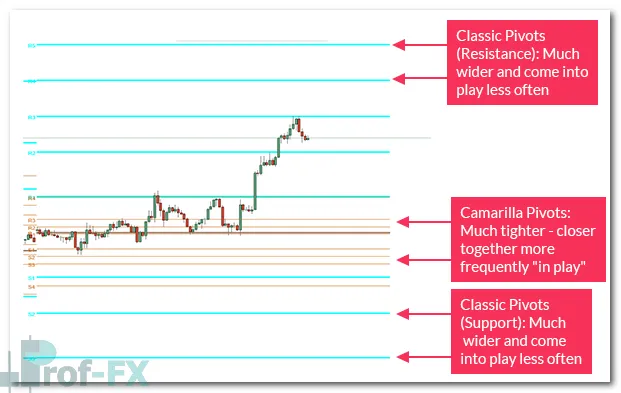
Originating from an equation that was once considered almost mysterious, Camarilla Pivot Points emerged as a specialized variation of pivot analysis favored by many short-term forex traders. When plotted on the daily chart, Camarilla pivots produce much tighter support and resistance levels compared to classical pivot points, naturally encouraging more frequent trading activity.
Because of these closer price levels, Camarilla Pivot Points are especially popular among day traders and intraday traders, particularly in liquid currency pairs where price often oscillates within well-defined ranges.
This highly versatile indicator is widely regarded as more than just a support and resistance tool. Many traders use Camarilla Pivot Points both for risk management and as a framework for trade entry and exit decisions. In this article, we will walk through each of these applications in a structured and practical manner.
Understanding Camarilla Pivot Points in Short-Term Trading
Like other pivot point methodologies, Camarilla Pivots are calculated using price data from a previous trading period. That period can be defined as:
- An hour
- A day
- A week
- Or even a month
However, in real-world trading conditions, Camarilla Pivots are most commonly applied using daily price data, making them particularly effective for traders focused on short-term price fluctuations.
The defining characteristic of Camarilla Pivot Points is their compressed structure, which places multiple support and resistance levels closer to current market price. This design reflects the assumption that markets often revert toward equilibrium unless a strong catalyst is present.
Risk Management with Camarilla Pivot Points
One of the primary uses of Camarilla Pivot Points is risk management. As discussed in broader pivot point analysis, simple mathematical calculations allow traders to transform historical price data into forward-looking reference levels.
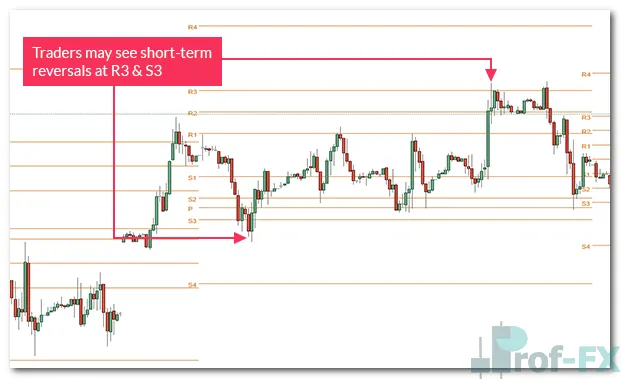
With Camarilla Pivots, special attention is often given to the third support and resistance levels (S3 and R3). Many traders believe that when price approaches these levels, the probability of a short-term reversal increases.
As a result:
- Traders holding profitable positions may choose to take profits near S3 or R3
- This helps lock in gains before a potential intraday reversal occurs
The chart below illustrates two separate reversals occurring within the same trading day on AUD/USD, highlighting how price reacts near Camarilla pivot extremes.
Using Camarilla Levels for Stop Placement
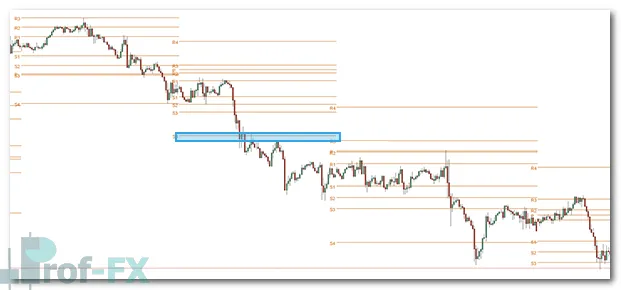
While S3 and R3 are often viewed as reversal zones, the fourth support and resistance levels (S4 and R4) are interpreted very differently.
Many traders believe that if price reaches S4 or R4, it signals that:
- Market sentiment may be shifting aggressively
- A breakout scenario could be developing
In this context, traders focus on damage control rather than reversals. Stop-loss orders are frequently placed just beyond S4 or R4 to protect against rapidly expanding losses if price accelerates in the breakout direction.
This dual interpretation – reversals near S3/R3 and breakouts near S4/R4—is what makes Camarilla Pivot Points especially powerful for intraday risk management.
Trading Camarilla Reversal Setups
Because traders associate S3 and R3 with increased reversal potential, many will actively look to enter counter-moves at these levels.
The basic framework is straightforward:
- If price reaches R3, traders may look for short opportunities
- If price reaches S3, traders may look for long opportunities
However, experienced traders rarely take these setups in isolation. Instead, they often combine Camarilla pivots with multiple time frame analysis to improve trade quality.
For example:
- If a trader identifies a long-term uptrend on the weekly or daily chart
- They may wait patiently for price to pull back toward the daily S3 Camarilla level
- This allows them to “buy cheaply” in alignment with the broader trend
The same logic applies in reverse for longer-term downtrends, where traders look to sell near the daily R3 Camarilla pivot.
Why Multiple Time Frame Analysis Enhances Camarilla Trades
Viewing the market from multiple perspectives allows traders to better understand context. A level that appears risky on a short-term chart may represent a high-probability opportunity when aligned with a dominant higher-timeframe trend.
This combination:
- Improves entry precision
- Allows tighter stop placement
- Enhances overall risk-to-reward ratios
For beginner traders, this approach reinforces disciplined decision-making rather than impulsive trading.
Trading Camarilla Pivot Breakouts
When price reaches the fourth Camarilla support or resistance level (S4 or R4), many traders interpret this as a sign that something significant is unfolding in the market.
Such moves are often associated with:
- Strong economic data releases
- Shifts in interest rate expectations
- Central bank communication
- Sudden changes in market sentiment
In these scenarios, traders may treat interactions with S4 or R4 as breakout opportunities, similar to the momentum-based strategies discussed in The Ballistics of Breakouts.
Rather than fading price, traders align with the move, looking to capture accelerated momentum once price breaks beyond established intraday boundaries.
Key Takeaways for Beginner Forex Traders
Camarilla Pivot Points offer a structured, rule-based framework specifically suited for short-term trading environments. Their closer support and resistance levels provide:
- Frequent trade opportunities
- Clear risk boundaries
- Logical profit-taking zones
When combined with sound risk management, multiple time frame analysis, and awareness of broader market conditions, Camarilla Pivot Points can become a powerful decision-making tool in the daily trading routine of forex traders.
For beginners, mastering Camarilla pivots helps build discipline, consistency, and confidence, especially in fast-moving markets where emotional decision-making can easily take over.


