


In forex trading, chart patterns play an important role in helping traders time entries, manage risk, and project profit targets. Among the many continuation patterns available, the bullish flag pattern stands out because it often appears during strong trends and can lead to explosive continuation moves when traded correctly.
In this article, I will walk you through how to identify, validate, and trade a bullish flag pattern, using the AUD/CAD currency cross as a real-market example. The explanation is presented step by step, with a focus on clarity, probability, and proper risk management—especially for beginner forex traders.
Understanding the Bullish Flag Pattern in Forex Trading
A bullish flag pattern is a trend continuation pattern, meaning it forms after a strong upward price move and signals the potential for the trend to resume once consolidation ends.
Despite its simplicity, this pattern is highly effective when traded in the right market context.
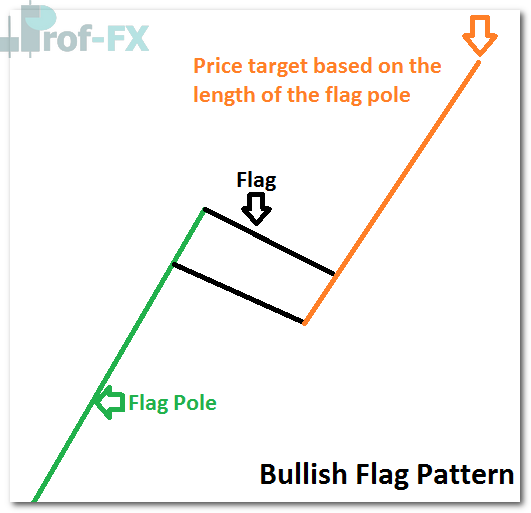
The Three Core Components of a Bullish Flag Pattern
A valid bullish flag pattern consists of three essential elements:
- The Flagpole
A sharp and impulsive move higher, driven by strong buying pressure. - The Flag (Consolidation Phase)
A period where price pauses and consolidates, typically forming a gently downward-sloping price channel. - A Strong Underlying Uptrend
The broader market structure must remain bullish, with higher highs and higher lows intact.
Step 1: Identify a Strong Uptrend (The Flagpole)
The first step is identifying a currency pair that is already in a clear and strong uptrend. This initial surge higher forms the flagpole, which reflects aggressive buying and strong momentum.
During this phase:
- Buyers are firmly in control
- Price advances rapidly
- Momentum indicators typically confirm strength
Eventually, even strong trends need to pause. This pause does not signal weakness—rather, it represents profit-taking and market digestion before the next potential move.
Step 2: Analyze the Flag (Healthy Price Consolidation)
After the flagpole forms, price enters a consolidation phase known as the flag.
Key characteristics of a high-quality bullish flag include:
- A downward-sloping or sideways channel
- Controlled price action with smaller candles
- A retracement that remains shallow
From a Fibonacci perspective:
- Retracements less than 38% are ideal
- Retracements greater than 50% weaken the pattern and may invalidate it
Because the bullish flag is a continuation pattern, the expectation is that once consolidation ends, price breaks higher in the direction of the original trend.
Why Fundamentals Matter: AUD Strength as a Supporting Factor
Technical patterns become even more powerful when they align with fundamental market drivers.
Over the past several months, global markets have shown strong risk-on sentiment, with capital flowing into:
- Commodities
- Equity markets
- Risk-based currencies
The Australian Dollar (AUD) has benefited significantly from this environment due to:
- Its higher interest rate profile
- Strong correlation with global growth and commodities
Given this backdrop, pairing the AUD against the Canadian Dollar (CAD) creates an attractive technical and fundamental setup for bullish continuation analysis.
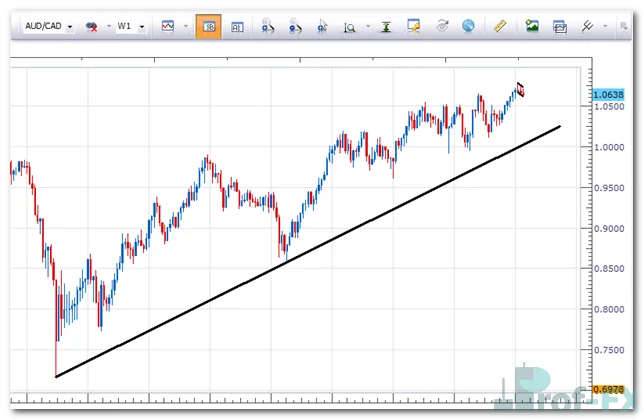
Historical Context: AUD/CAD Bull Flag Example
The AUD/CAD currency pair has a history of respecting bullish flag structures.
Back in October 2011, AUD/CAD formed a textbook bullish flag:
- A strong initial uptrend
- A shallow, downward-sloping consolidation
- A breakout that led to continued upside momentum
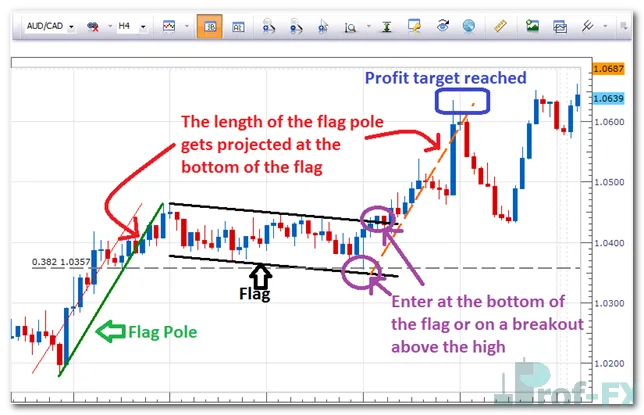
Trading the Completed Bullish Flag Pattern
In the completed pattern example:
- The flagpole is marked by a strong green impulse move
- The flag formed as a downward-sloping price channel
- The retracement measured approximately 38% of the prior move
Entry Strategies for Bullish Flags
Traders generally have two entry approaches:
- Aggressive Entry
Buying near the lower boundary of the flag channel, using support as a guide. - Conservative Entry
Waiting for a confirmed breakout above the upper channel before entering.
Profit Target Projection
Profit targets are commonly set by:
- Measuring the length of the flagpole
- Projecting that distance upward from the bottom of the flag
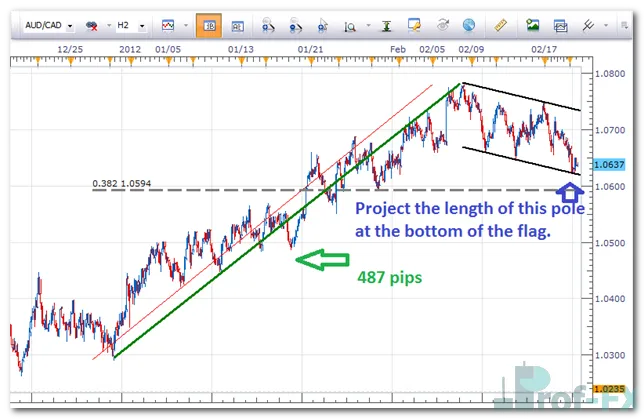
Current AUD/CAD Bullish Flag Opportunity
Fast-forwarding to the current market environment, AUD/CAD once again shows characteristics of a developing bullish flag:
- Price continues to trend higher overall
- Consolidation is forming within a gently downward-sloping black channel
- Market structure remains bullish
This setup offers traders a minimum 1:2 risk-to-reward ratio, which aligns with professional trading standards.
Example Trade Plan for AUD/CAD
A structured trading plan may look like this:
- Entry: Near the lower boundary of the flag channel around 0637
- Stop Loss: Below the recent swing low near 0590
- Trade Management:
- Move stop loss to break even once price reaches the top of the channel
- Upside Target:
- If the pattern completes, price projection suggests a potential move toward 10
- If the pattern completes, price projection suggests a potential move toward 10
This approach balances risk control, patience, and trend alignment.
Key Takeaways for Forex Traders
- Bullish flag patterns are trend continuation setups, not reversal patterns
- Strong momentum and shallow retracements are critical for validity
- Combining technical structure with fundamental context improves probability
- Proper risk management is essential to long-term consistency
When traded with discipline and context, the bullish flag pattern can become a powerful tool in any forex trader’s strategy—especially for those learning how to trade trends effectively.


