


A well-structured forex pivot point strategy can become a trader’s best ally when it comes to developing market bias, placing stop losses, and identifying realistic profit targets. For decades, pivot points have been widely used by professional and retail traders alike because they offer objective, repeatable price levels that the market often respects.
The core idea behind pivot points is simple: price frequently reacts to prior extremes. Unless a strong external catalyst – such as major economic data or central bank intervention – pushes price aggressively, the market cycles often pauses, reverses, or consolidates near these predefined levels. This is what makes pivot point trading strategies both practical and versatile.
In this guide, we will cover:
- What a pivot point is
- How pivot points are calculated
- How to use pivot points in forex trading
- Popular pivot point trading strategies
- The difference between pivot points and Fibonacci retracements
What Is a Pivot Point in Forex Trading?
A pivot point is a technical indicator used to gauge potential future price movements. Forex traders rely on pivot points to determine trend bias and to identify key levels of support and resistance.
These levels can then be used to plan:
Because pivot points are calculated using objective price data, they remove much of the subjectivity that often affects discretionary trading decisions.
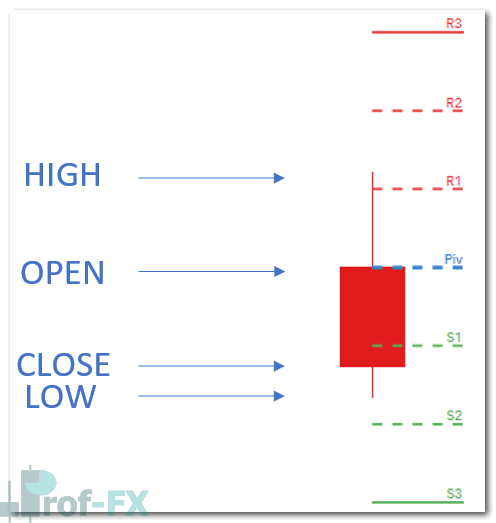
Pivot Point Example
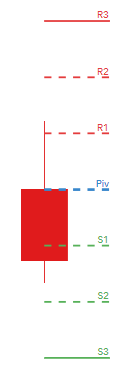
How to Calculate Pivot Points
The most commonly used version of pivot points is known as floor trader pivots. These are calculated using the high, low, and close of the previous trading period.
Pivot Point Formula
- Pivot Point (PP) = (High + Low + Close) / 3
- First Resistance (R1) = (2 × PP) − Low
- First Support (S1) = (2 × PP) − High
- Second Resistance (R2) = PP + (High − Low)
- Second Support (S2) = PP − (High − Low)
- Third Resistance (R3) = High + 2(PP − Low)
- Third Support (S3) = Low − 2(High − PP)
Most modern trading platforms calculate these levels automatically. Traders can apply pivot points across different time frames, including daily, weekly, and monthly pivots.
The Origin of Pivot Point Calculations
Before computers became widely available, floor traders and market makers needed a quick and reliable method to determine whether price was relatively “cheap or expensive”.
Pivot points were developed as a simple mathematical solution. By averaging the previous period’s high, low, and close, traders could establish a central reference point – the pivot – from which support and resistance levels were derived.
This method proved effective and has remained relevant even in modern, algorithm-driven markets.
How to Use Pivot Points in Forex Trading
Pivot points function similarly to traditional support and resistance levels. Price frequently reacts to these levels, often testing them multiple times, which strengthens their relevance.
Forex traders rarely rely on pivot points in isolation. Instead, they combine them with:
General Guidelines for Trading with Pivot Points
- Price above the pivot → bullish bias
- Price below the pivot → bearish bias
- Longer-term pivot points (weekly/monthly) are generally more reliable due to a larger data set
- Support and resistance levels act as extensions of the central pivot
Pivot Point Trading Strategies
1. Pivot Point Swing Trading Strategy
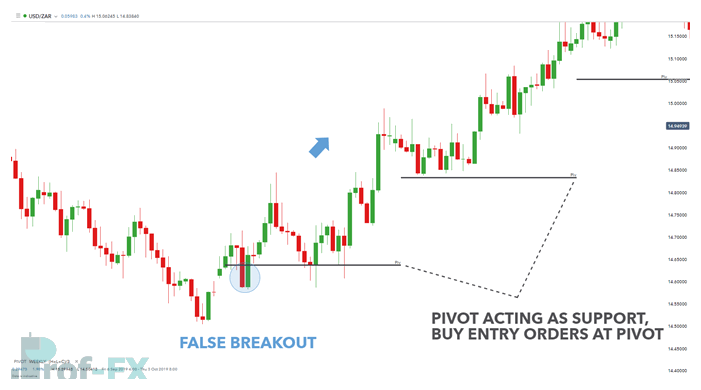
For traders who prefer medium to long-term trades, pivot points can be applied to weekly or monthly time frames.
In the example below, a weekly chart displays only the pivot level. After price breaks above previous pivot resistance, a trend reversal to the upside becomes evident. Once broken, the pivot often transitions from resistance into support.
Although false breakouts can occur, pivot levels help traders maintain directional bias and stay aligned with broader market structure.
This approach is particularly suitable for swing traders who operate on longer holding periods.
USD/ZAR Weekly Chart
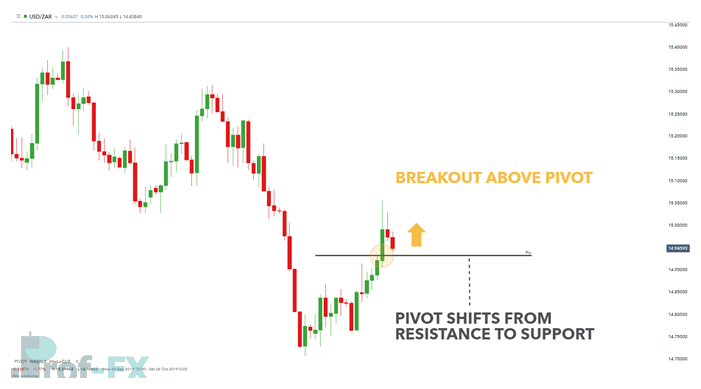
2. Pivot Point Breakout Strategy
Some traders focus on periods of increased market volatility, where the probability of large price moves is higher. Pivot point breakouts can be particularly effective during these conditions.
Traders monitor breaks above resistance or below support as potential trade entry opportunities. This strategy is especially effective when applied to weekly and monthly pivot levels, which tend to be respected by institutional participants.
In the example below, the pivot alone is used as a key price level. Before the breakout, price respects the pivot multiple times. Once price breaks and holds above the pivot, a bullish bias is established, providing a framework for long entries.
USD/ZAR Four-Hour Chart
Pivot Points vs Fibonacci Retracements and Extensions
Both pivot points and Fibonacci retracements/extensions are used to identify hidden support and resistance levels. However, they differ in how these levels are derived.
Pivot Points
- Calculated from the previous period’s high, low, and close
- Based on objective price averages
- Focus on prior period price extremes
Fibonacci Retracements/Extensions
- Based on fixed ratios derived from the Fibonacci sequence
- Applied to individual price waves
- Focus on impulse and corrective structures
Each tool has its strengths, and many traders choose to use both together for added confluence.
Further Learning and Practical Application
To strengthen your understanding of pivot points:
- Learn the fundamentals of floor trader pivots
- Build a foundation with support and resistance trading
- Apply hourly, daily, weekly, and monthly pivot points to assess market sentiment across forex and other asset classes
Pivot points remain one of the most time-tested and practical tools in technical analysis, especially when combined with sound risk management and clear market structure.
Prof FX provides professional forex news and technical analysis focused on the trends that influence global currency markets.


