Fibonacci Retracements is one of the widely used tools by traders for technical analysis. Principally, the tool helps in identifying the potential support and resistance levels. However, always be mindful, it is just a tool and using it alone is barely constructive unless it is used properly in conjunction with other elements.
In this article, we will understand what Fibonacci retracement tool is, followed by the different ways in which Fibonacci retracement tool can be used to effectively execute trades.
IMPORTANT: This mini series of forex trading blogs are not considered advice on how you should trade, but merely is providing a tool you can use to compliment your existing forex trading strategy.
What is the Fibonacci Retracement tool?
The Fibonacci Retracement tool is derived from the Fibonacci sequence. The key retracement levels are 0%, 23.6%, 38.2%, 61.8%,78.6%and 100.0%. Every level associated to these percentages is a horizontal line that represents a support or resistance level from where the price could potentially reverse.
The word retracement is synonymous with pull back/correction. The tool is highly effective if used in trending markets i.e. in an uptrend or in a downtrend (read more about trend lines). For instance, in an uptrend, when a price creates a pivot high, it can then pull back or retrace to the retracement levels mentioned above. Similarly, in a downtrend, when a price creates a pivot low, it can then potentially pull back or retrace to the Fibonacci retracement levels. Let us now have a glance as to how it can be drawn on a chart.
Even though it is a tool, it is also considered as an indicator as it helps in predicting the future price movements along with the levels where a price could possibly retrace till.
How do I draw Fibonacci retracement levels on a chart?
In order to draw them correctly on any chart, it is essential to identify two things:
- Identify the trend (Uptrend or a downtrend)
- Identify a leg with pivot high and pivot low.
Leg: A leg refers to the price movement from alow price point to a high price point or vice versa. In other words, it is a price action from support to resistance or from resistance to support.
In an up trend, it can be drawn by starting with the pivot low till the pivot high of the leg. A trader should look for a buy/long opportunity after the retracement.
Whereas, in a downtrend, it can be drawn by starting with the pivot high till the pivot low of the leg. A trader should look for a sell/short opportunity after the retracement.
Let us now visualize each of these instances on a chart.
Uptrend:
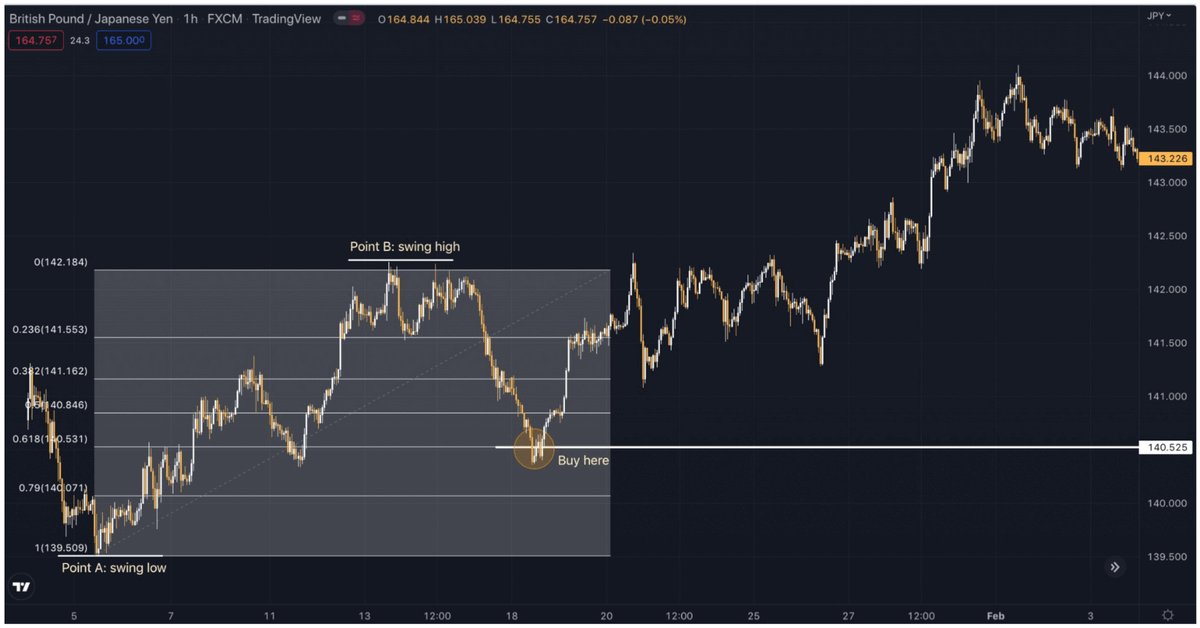
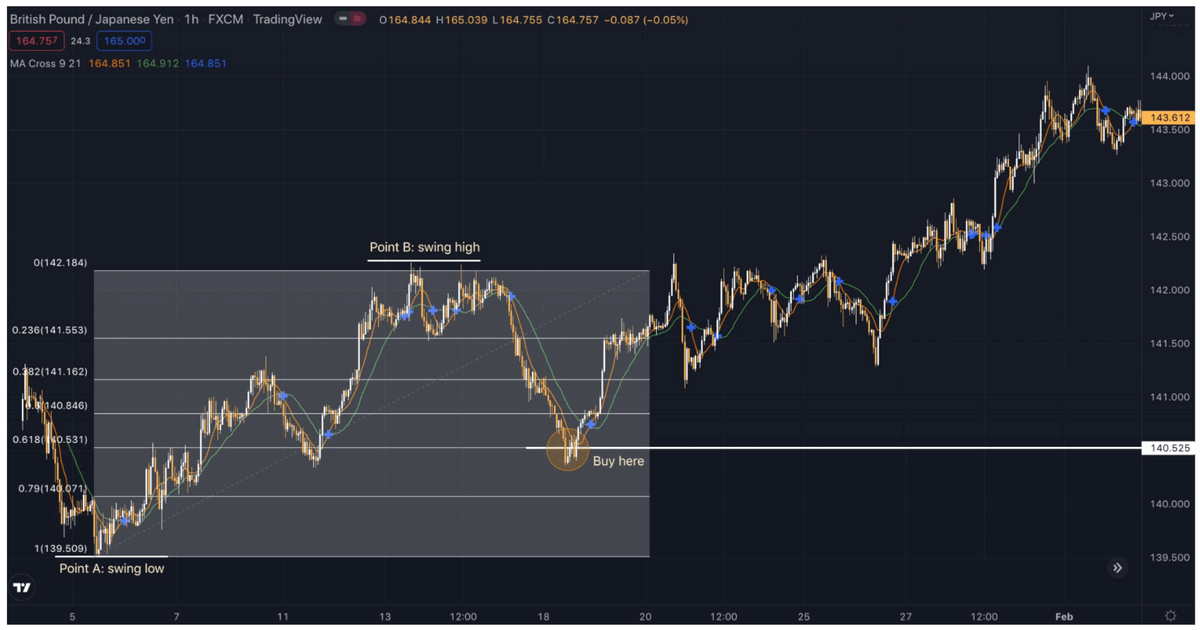
In the chart below, firstly, we identified that the market for GBPJPY is in an uptrend which can be seen as the price is making higher highs and higher lows. Then we draw the Fibonacci Retracement from point A which is the starting point/lowest point (Retracement 1%) of the leg to Point B which is the highest point of the leg (Retracement 0%). Here onwards, we will look for a buy/long opportunity after the price corrects to one of the retracement levels. In the example below, the price has retraced from 0.618 level.
Downtrend:
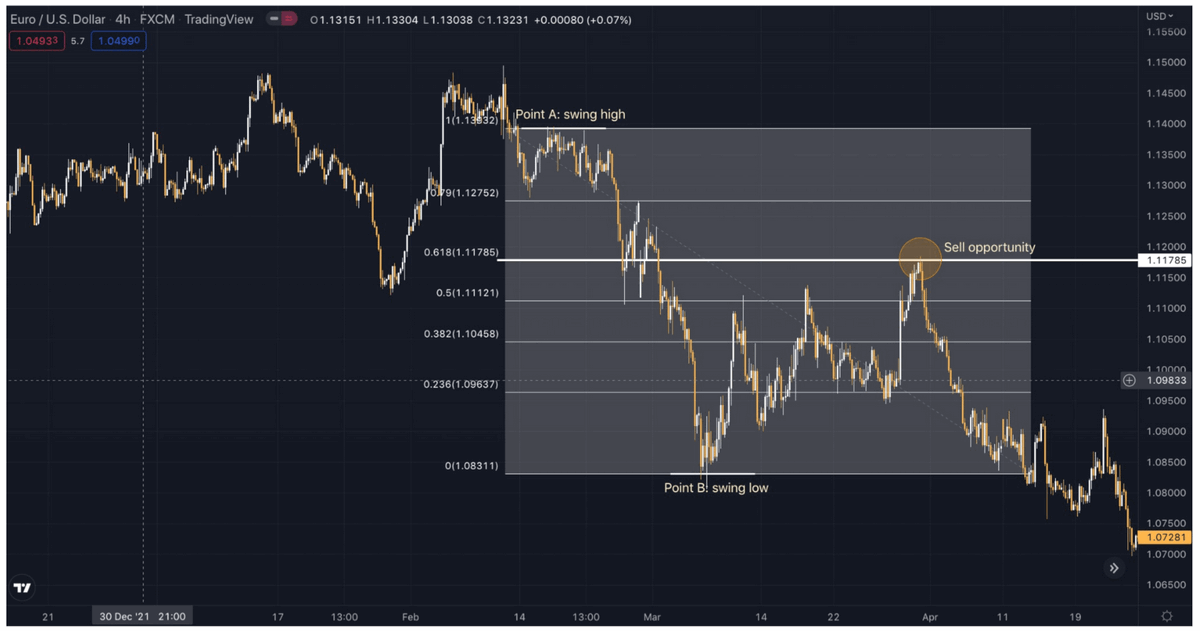
Likewise, we identified that the market for EURUSD is in a downtrend which can be seen as the price is making lower highs and lower lows. Then we draw the Fibonacci Retracement from point A which is the starting point/highest point (Retracement 1%) of the leg to Point B which is the lowest point of the leg (Retracement 0%). Here onwards, we will look for a sell/short
opportunity after the price corrects to one of the retracement levels. In the example below, as it can be seen that the price has retraced from 0.618 level.
Now that we have defined Fibonacci retracement and have shown how it can be drawn on a chart, we will place focus on the more important question.
How do I know which retracement level will the price retrace to?
As stated in the beginning of this article, Fibonacci retracement is just a tool and using it alone is barely constructive unless it is used properly in conjunction with other elements. So what are the other elements? Hereafter, we will combine Fibonacci retracements with the following:
- Support and Resistance
- Moving Averages
- Relative Strength Index (RSI)
1. Fibonacci retracements in conjunction with support and resistance:
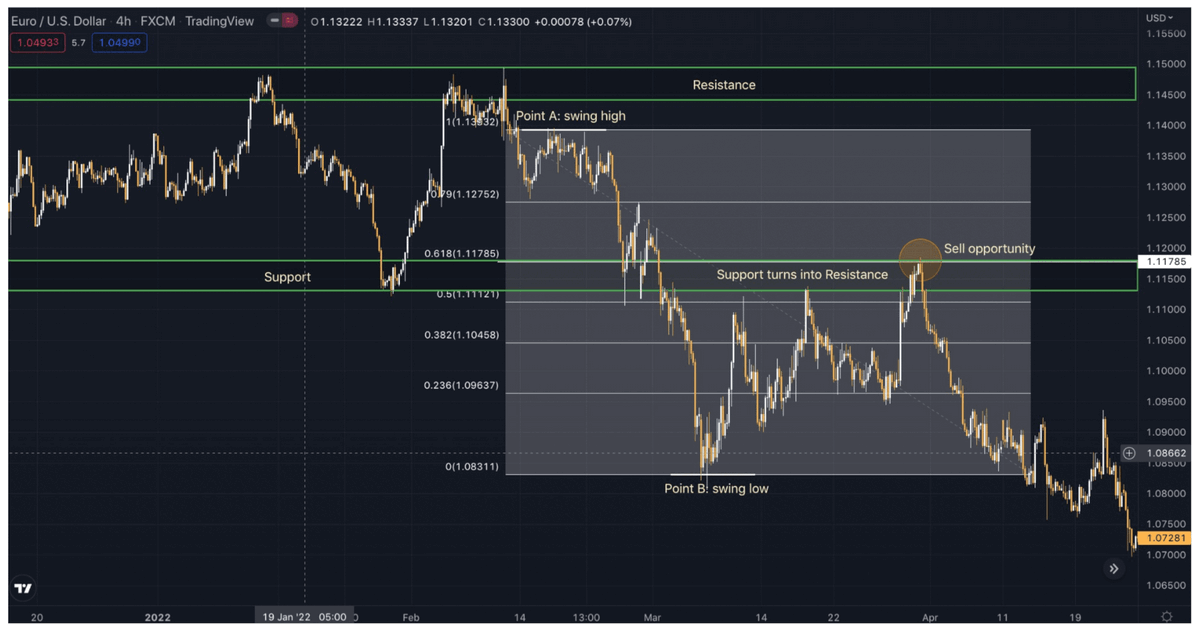
Let us now observe the same chart for EURUSD and plot support and resistance lines to better understand as to why 0.618 Retracement level was potentially an ideal setup for a sell. In the chart below, we have identified the support and resistance zones. Once plotted, it can be observed that previously broken support becomes the resistance now and it is in confluence with the 0.618 retracement level thus creating a stronger indication for a sell.
2.Fibonacci retracements in conjunction with Moving averages (MA):
Presented below is the same chart for GBPJPY with moving averages (MA 9 and MA 21) plotted on it to better understand as to why 0.618 Retracement level was potentially an ideal setup for a buy. It can be observed that the MA 9 is crossing above MA 21 which is in confluence with the 0.618 retracement level thus creating a stronger indication for a buy.
3.Fibonacci retracements in conjunction with Relative Strength Index (RSI):
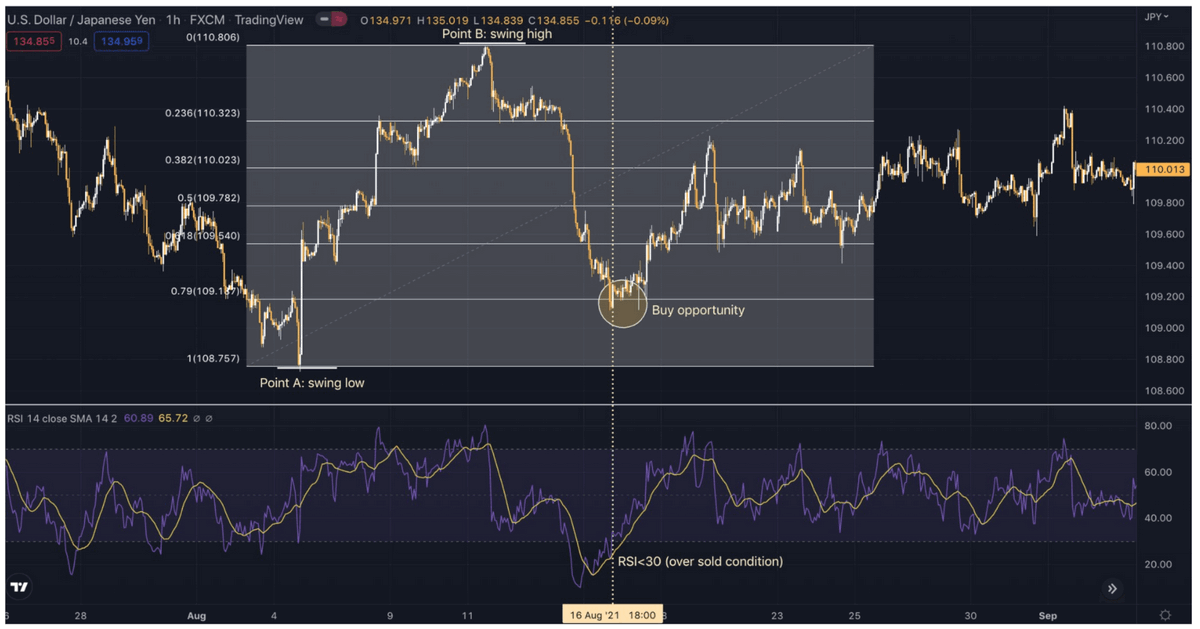
In this example, we have taken a chart of USDJPY. Here we have seen the chart retracing after creating higher highs and higher lows. Therefore, we then drew the Fibonacci Retracement from point A which is the starting point/lowest point (Retracement 1%) of the leg to Point B which is the highest point of the leg (Retracement 0%). In the example below, the price has retraced till 0.786 level. Let us now observe the Relative Strength Index (RSI) indicator to better understand why 0.786 retracement level was potentially an ideal setup for a buy. Looking at the RSI, we can see that the market was oversold as the RSI was less than 30 which is in confluence with the 0.786 retracement level thus creating a stronger indication for a buy.
On that account, it is vital to always use Fibonacci retracements with any other confluence to better identify which retracement level price could possibly retrace to thus increasing the probability for a winning trade.
In this article, we touched upon a few confluences only. There is no one particular strategy which is perfect. Every trader has its own way of analyzing charts. It is always advised to stick to the strategy that works best for you as a Funded trader.
Constantly switching between strategies can negatively affect your trading psychology and might cause you to lose your account.
Traders must incorporate risk management no matter what strategy it is as that is the only way to see consistent profitability and growth in the long term.

