


Support and resistance levels are among the most widely utilized technical tools in the Forex market. These pivotal charting points help traders identify trading directions, optimize entry timings, and plan position exits. Often, these crucial levels are identified by drawing lines on charting software. In this article, we’ll dive deep into the art of drawing and utilizing trendlines for successful Forex trading.
Drawing Trendlines: The Basics
When starting to draw trendlines, remember that every trader has a unique perspective. The placement of your trendlines might differ slightly from another trader’s. This variance is acceptable as long as you adhere to the fundamental rule: a valid trendline must connect at least two significant points on the chart. Let’s explore some practical examples.
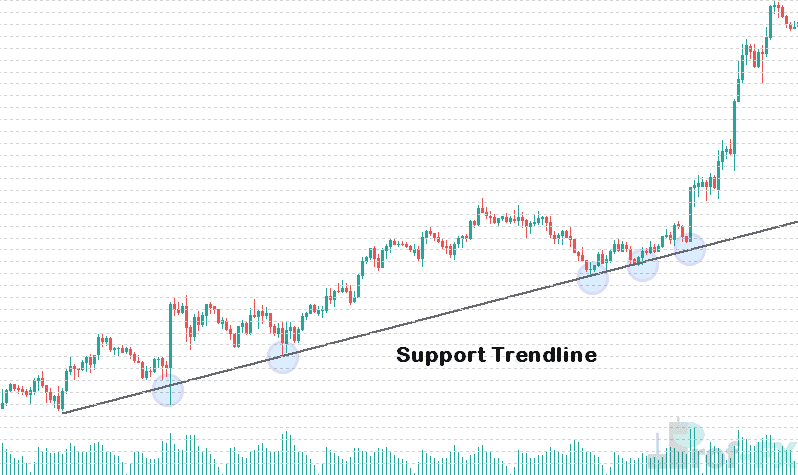
The first example features a weekly chart of the NAS100 (Nasdaq). Over the past 42 months, the NAS100 has risen by 1832 points, confirming an uptrend. To illustrate this, we draw a trendline by connecting a series of ascending low points, highlighted in blue circles. This line serves as a support level, acting as a floor where prices tend to hold.
Once the trendline is established, traders can capitalize on the trend by initiating buy orders at strategic moments. The ideal time to enter long positions is when the price dips to the support level and rebounds. If the price touches the support line but doesn’t close below it, it creates an opportunity to establish new buy entries. Additionally, traders can manage risk effectively by setting stop losses below the support level.
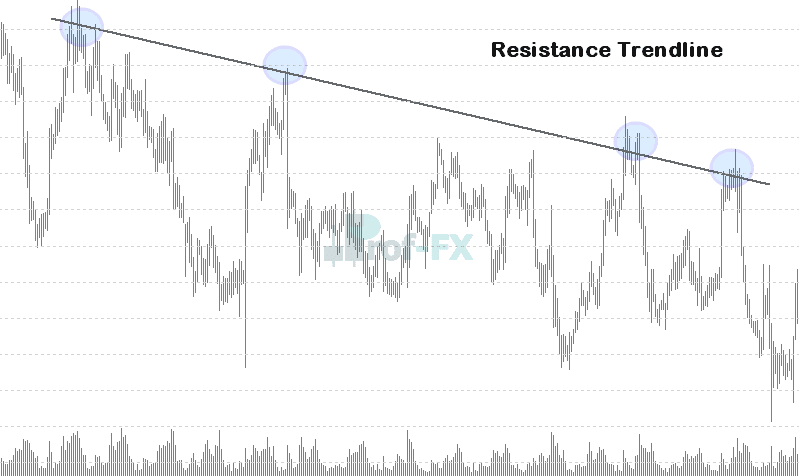
In our second example, we analyze an 8-hour chart of the EURAUD in a downtrend. The resistance trendline is formed by connecting the high points on the graph, marked in blue. This chart shows that the price has recently tested the resistance line for the fourth time. Notably, the more a trendline is tested without breaking, the weaker it becomes. For this reason, trend traders typically prefer to trade during the third or fourth test of a trendline.
With the resistance trendline sloping downward and the price trending lower, the EURAUD exhibits a strong downtrend. Trend traders can leverage this information to trade market swings by opening sell positions when the price rises to resistance. Traders should wait for the price to touch the resistance line without closing above it before entering short trades. When the price resumes moving in the trend’s direction, it signals a valid selling opportunity. In such scenarios, stop losses are strategically placed above the resistance level.
Conclusion
Mastering the use of trendlines in Forex trading requires practice, observation, and an understanding of market dynamics. By correctly identifying support and resistance levels, traders can enhance their strategies and improve decision-making. Remember, the effectiveness of trendlines lies in their proper application and the discipline to adhere to risk management principles.


