


Lagging indicators often carry a reputation for being misunderstood, but they remain one of the most reliable tools for analyzing financial markets. This article delves into the essentials of lagging indicators, providing insights into their definitions, examples, and benefits.
In this article, What You’ll Learn:
- What are lagging indicators?
- Examples of lagging indicators
- The benefits of using lagging indicators
What Is a Lagging Indicator?
A lagging indicator is a technical analysis tool that evaluates market trends using an average of historical price action. These indicators are designed to identify trends, offering traders valuable insights for determining entry and exit points.
Lagging indicators are particularly effective in trending markets. However, due to their reliance on past data, they often signal movements after a trade opportunity has begun, which can result in missed profit potential.
Examples of Lagging Indicators
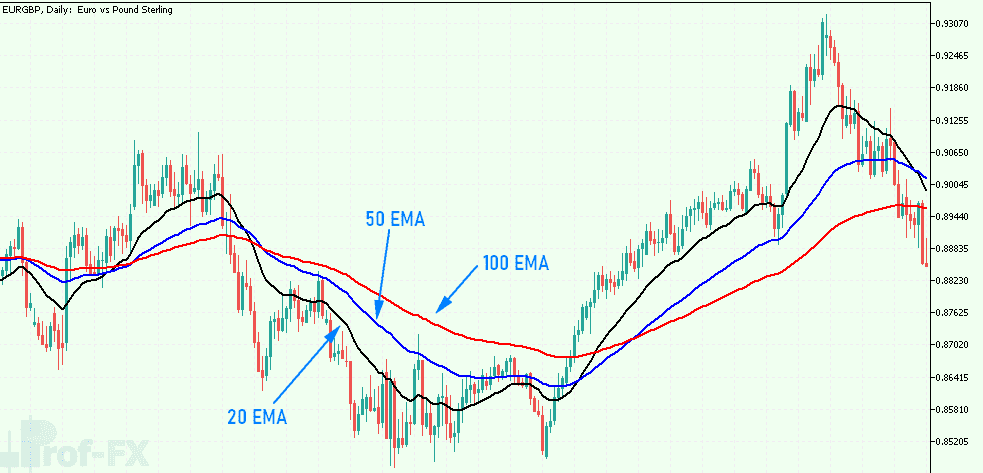
The most commonly used lagging indicators center around **moving averages**. Popular examples include:
- Simple Moving Average (SMA)
- Exponential Moving Average (EMA)
- Moving Average Convergence Divergence (MACD)
Each indicator processes historical price movements through specific formulas, generating unique signals. These tools are highly customizable, allowing traders to adjust parameters for tailored analysis.
Simple Moving Average (SMA)
The SMA calculates the average closing price of a financial instrument over a defined time frame, offering a straightforward method for trend analysis.

Exponential Moving Average (EMA)
The EMA refines the SMA by placing more weight on recent price movements, providing a clearer reflection of current trends.
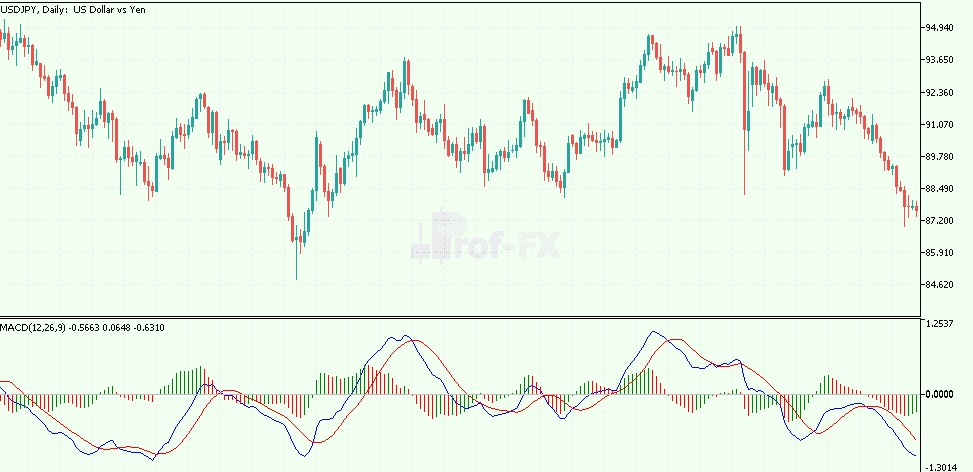
Moving Average Convergence Divergence (MACD)
The MACD measures the relationship between multiple EMAs, generating signals based on their convergence and divergence.
Download Double Line MACD Indicator:
The Benefits of Lagging Indicators
Lagging indicators offer several key advantages, especially for traders aiming to refine their strategies. Here are some of their benefits:
- Confirmation-Based Entries: The reliance on historical data ensures that trades are supported by solid confirmations, reducing impulsive decisions.
- Defined Entry and Exit Points: Lagging indicators provide clarity on when to enter or exit trades.
- Exceptional Performance in Trending Markets: These indicators shine in strong, directional markets, helping traders capitalize on sustained movements.
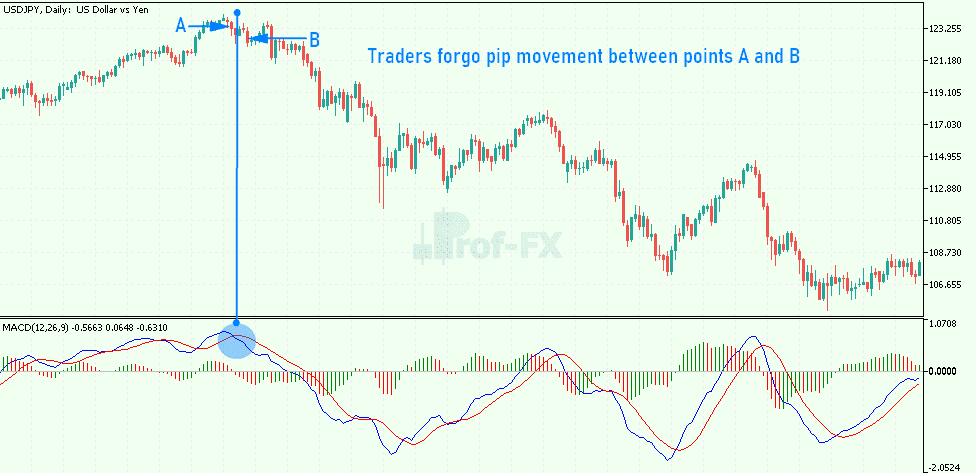
For instance, the chart below demonstrates a MACD crossover strategy applied to USD/JPY. Entry is signaled when the MACD line crosses the signal line. While initial gains between Point A and Point B are missed, the trade setup allows traders to capture a significant pip movement from Point B to the swing low.
Lagging Indicators: A Summary
Lagging indicators are a versatile and valuable tool for forex traders. Their ability to provide trend confirmations and support trading strategies makes them a staple in technical analysis. By understanding and incorporating lagging indicators, traders can enhance their decision-making processes and improve overall market performance.


