


Technical Analysis Charts – Talking Points
- Technical chart analysis helps traders identify price patterns, market structure, and trends
- Understanding charts is a critical foundation for beginner traders entering the forex market
- This guide explains the three most widely used chart types in technical analysis and how traders apply them in real market conditions
Technical analysis focuses on studying historical price data to understand market behavior and anticipate potential future movements. Traders achieve this by using different technical chart types, combined with indicators and price-based tools. While chart interpretation may initially feel overwhelming for novice traders, mastering the basics of technical analysis is essential for building confidence and consistency in trading.
In this article, I will walk you through the most popular technical analysis charts used in forex trading, explain how they work, and outline when each chart type is most effective. The goal is to give beginner traders a clear and practical understanding, without unnecessary complexity.
How Many Types of Technical Analysis Charts Are There?
There are three primary chart types used in technical analysis:
- Line charts
- Bar charts (HLOC)
- Candlestick charts
All three chart types are derived from the same underlying price data. The difference lies in how that data is visually displayed, which directly impacts the type of analysis a trader can perform.
These charts are widely used across multiple markets, including forex, stocks, indices, and commodities, and are universally supported by most professional trading platforms. While other chart types exist, this article focuses on these three because they remain the industry standard among retail traders, institutional participants, and technical analysts.
The Top 3 Technical Analysis Charts for Trading
Line Charts: A Clean and Simplified Market View
Best for trading: Stocks
Trading experience level: Beginner
Technical analysis approach: Holistic market overview with reduced noise
Key advantage: Helps limit emotional decision-making
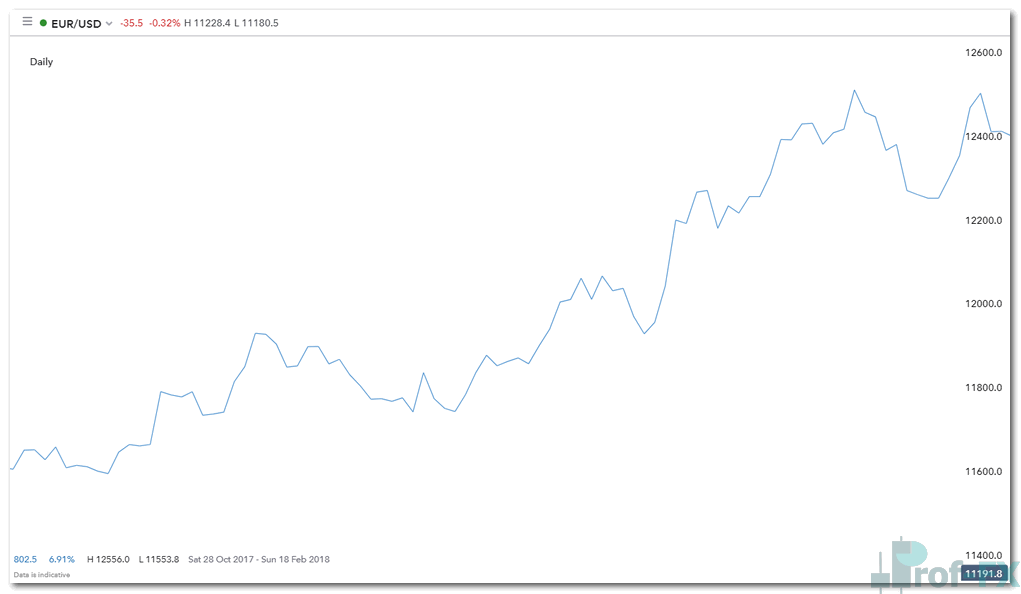
A line chart displays only one data point per period: the closing price. Each closing price is connected to the previous one, forming a continuous line that is easy to follow.
Because of its simplicity, the line chart is commonly used in financial media, such as television broadcasts, newspapers, and online market summaries. While it offers less detail than bar or candlestick charts, it provides an excellent at-a-glance overview of market direction.
One overlooked advantage of the line chart is its ability to help traders manage emotions. By using a neutral color scheme, such as blue or black, the chart removes the visual impact of sharp price fluctuations that appear more dramatic on candlestick or bar charts.
Expert insight:
Since line charts reflect only closing prices, experienced traders often use them to analyze daily or weekly closing levels, identify long-term trends, or examine broader market waves without the distraction of intraday volatility.
Bar (HLOC) Charts: Detailed Price Information for Deeper Analysis
Best for trading: Forex, stocks, indices, and commodities
Trading experience level: Intermediate
Technical analysis approach: Price-based analysis using HLOC data
Key advantage: Provides detailed insight into market structure and key levels
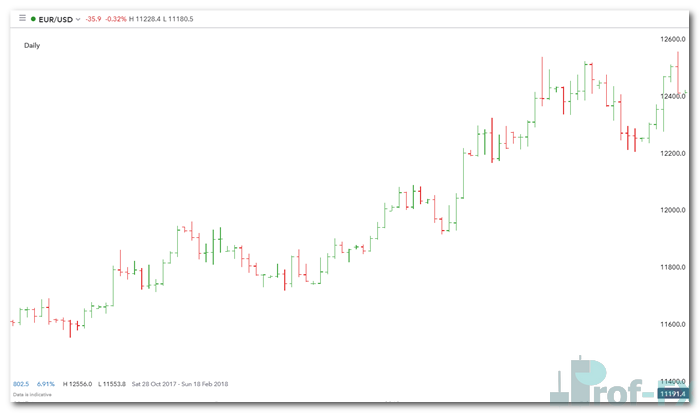
Bar charts display four critical price points for each period:
- High
- Low
- Open
- Close
The vertical line represents the high and low price range. A small dash on the left marks the opening price, while a dash on the right indicates the closing price.
Bar charts allow traders to quickly assess market sentiment. A bar that closes higher than it opens signals bullish pressure, while a bar that closes lower indicates bearish sentiment for that period.
Compared to candlestick charts, bar charts offer a cleaner visual presentation, as they typically avoid bold colors and filled bodies. This makes them especially useful for traders who want to focus on trend direction, support and resistance levels, and precise entry points without visual clutter.
Candlestick Charts: The Most Popular Chart in Forex Trading
Best for trading: Forex, stocks, indices, crypto and commodities
Trading experience level: Intermediate
Technical analysis approach: Price action and pattern-based analysis
Key advantage: Combines rich data with intuitive visual clarity
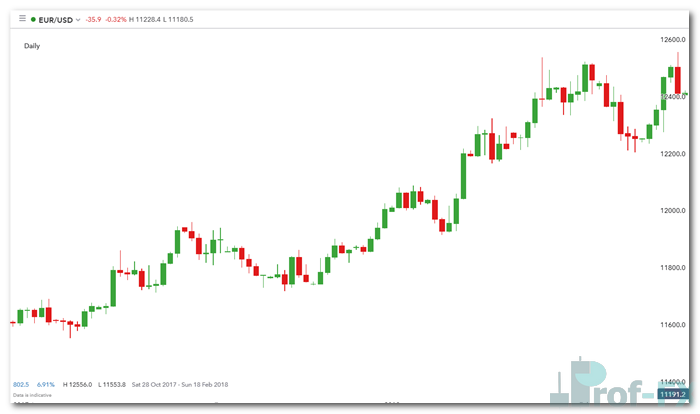
Candlestick charts display the same HLOC data as bar charts but in a more visually intuitive format. Each candlestick consists of:
- A body, showing the open and close prices
- Wicks (shadows), showing the high and low prices
Most charting platforms use green and red candles by default. A green candle indicates that price closed higher than it opened (bullish), while a red candle shows that price closed lower than it opened (bearish).
Candlestick charts are by far the most widely used chart type in forex technical analysis. They provide detailed price information while remaining easy to interpret at a glance. This balance makes them especially effective for identifying price action patterns, momentum shifts, and market psychology.
For traders interested in expanding their skill set, learning common candlestick patterns can significantly enhance trade timing and decision-making.
How to Analyze Technical Charts Effectively
Chart analysis techniques will vary depending on:
- The trading strategy being used
- The market being traded
- The time horizon of the trade
Consistency is critical. Traders should become comfortable with one chart type and strategy before expanding to others. Applying the same analytical framework repeatedly helps build discipline and reduces emotional trading decisions.
Before selecting a technical analysis chart, traders should ask:
- What trading strategy am I using?
- Am I trading short-term, medium-term, or long-term setups?
Once these questions are answered, selecting the most appropriate chart type becomes significantly easier.
Building a Strong Technical Analysis Foundation
Technical traders adopt different styles and strategies, and no single approach works for everyone. Exploring these methods will help you determine whether technical analysis aligns with your personality and risk tolerance.
To deepen your understanding:
- Study the core principles of technical analysis
- Explore multiple time frame analysis for broader market context
- Expand your knowledge beyond traditional charts by learning about Heikin Ashi, Renko, and Point & Figure charts
A solid understanding of technical charts forms the backbone of effective forex trading. When combined with sound risk management and market awareness, technical analysis becomes a powerful tool for navigating the global currency markets with confidence.


