Why Triangle Patterns Matter in Ranging Markets
Trading during ranging or congested market conditions can be particularly challenging. Price often moves sideways, momentum becomes inconsistent, and false signals appear more frequently. Because of these conditions, many price action traders prefer to wait patiently for a clear breakout before initiating a position.
One of the most widely used price action patterns during market consolidation is the triangle pattern. This article will explain how triangle formations develop, why they matter, and how traders can approach them using a structured, risk-aware trading plan.
What Is a Triangle in Price Action Trading?
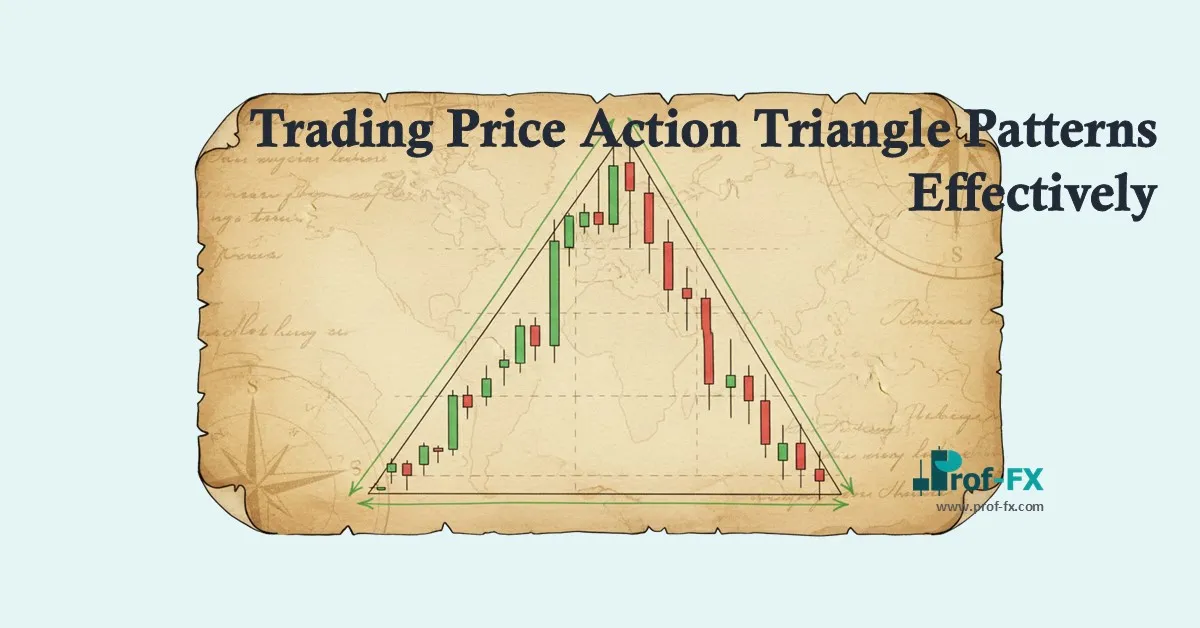
A triangle is a consolidation phase where price action gradually narrows, forming a shape that resembles a triangle or wedge on the chart. This occurs as buyers and sellers reach a temporary balance, causing volatility to contract over time.
Below is an example of a descending triangle, one of the most common triangle formations used by price action traders.
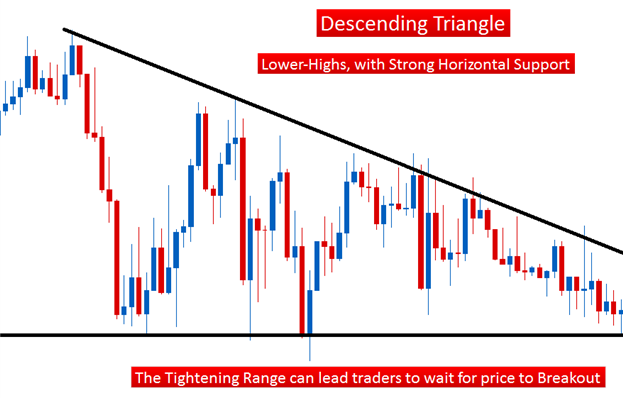
In this pattern, the currency pair continues to make lower highs, signaling selling pressure. However, price repeatedly fails to break below an established support level, indicating that buyers are still defending that price zone.
This tightening range between declining resistance and flat support creates a compression effect. For price action traders, this type of consolidation can offer a high-probability setup once the market decides on direction.
Before discussing trade execution, it is important to understand that triangles come in several variations, each with slightly different characteristics.
How to Trade Ascending and Descending Triangle Patterns
The most common way to trade triangle patterns is by anticipating and trading the breakout once price breaks through either support or resistance. Ascending and descending triangles are particularly attractive because they contain a clear structural bias.
Let’s revisit the descending triangle example.
Trading the Descending Triangle
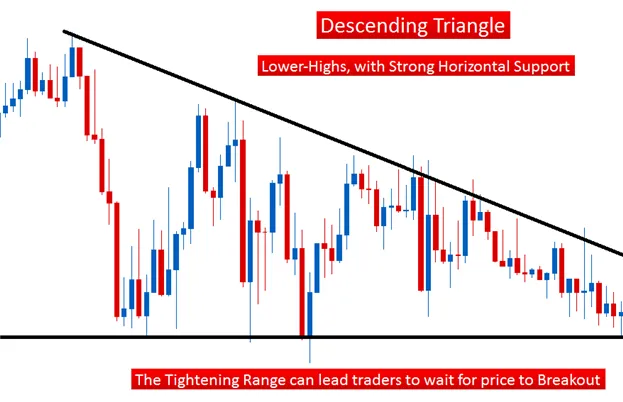
In a descending triangle:
- Price forms lower highs
- Support remains relatively flat and well-defined
This structure suggests that sellers are becoming increasingly aggressive, while buyers are defending a specific price level. If bearish momentum becomes strong enough to break support, price may accelerate lower.
As a result, many traders approach descending triangles with a bearish bias. A common strategy is to place a sell stop order below support, allowing traders to enter short positions only if price confirms the breakout.
Trading the Ascending Triangle
The logic behind an ascending triangle is the inverse of a descending triangle.
In an ascending triangle:
- Price forms higher lows
- Resistance remains flat and clearly defined
This indicates growing buying pressure, even though price has not yet been able to break above resistance. Traders often adopt a bullish bias, preparing to enter long positions once resistance is decisively broken.
A typical approach is to place a buy stop order above resistance, ensuring that the trade is only triggered if bullish momentum confirms itself.
How to Trade Symmetrical Triangle Patterns
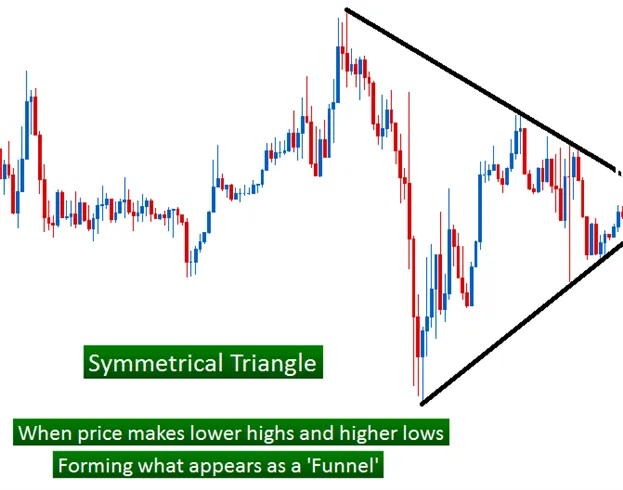
Symmetrical triangles differ from ascending and descending triangles in one key way: they lack a clear directional bias.
In a symmetrical triangle:
- Price forms higher lows
- Price also forms lower highs
- Both support and resistance trend inward
Because both buyers and sellers are gradually losing dominance, predicting breakout direction becomes more difficult.
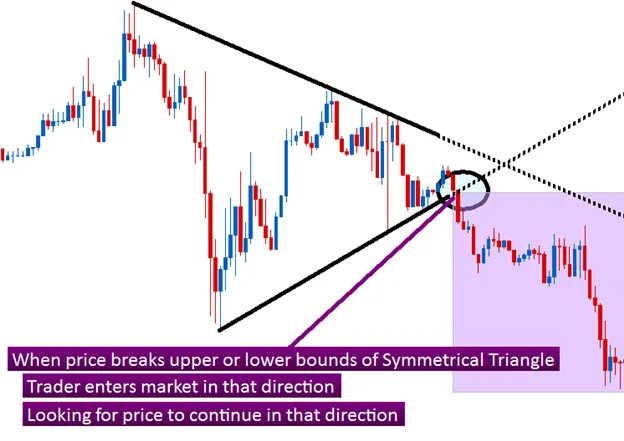
For this reason, many traders choose a neutral approach when trading symmetrical triangles. Instead of anticipating direction, they wait for price to break and close beyond either support or resistance, then trade in the direction of that confirmed breakout.
This approach reduces guesswork and aligns the trade with emerging momentum.
Why Breakout Confirmation Is Critical
One of the most important lessons when trading triangle patterns is patience. False breakouts are common during consolidation phases, particularly in low-volatility environments.
Waiting for:
- A clear break
- A candle close beyond the pattern
- Confirmation of momentum
helps traders avoid premature entries and unnecessary losses. Combined with disciplined stop-loss placement and proper position sizing, triangle breakouts can offer favorable risk-to-reward opportunities.
Key Takeaways for Trading Price Action Triangles
Triangle patterns represent periods of market indecision followed by expansion. Whether ascending, descending, or symmetrical, these formations help traders visually identify consolidation and prepare for directional moves.
By focusing on structure, waiting for confirmation, and respecting risk management principles, traders can use triangle patterns as a reliable framework for trading price action during congested market conditions.
As always, no pattern works all the time. Consistency comes from disciplined execution, patience, and a commitment to protecting trading capital.