Many traders actively seek opportunities during volatile market conditions because these periods often present strong trading potential. However, while volatility can create attractive setups, precise timing remains a critical factor in trade execution.
The purpose of this article is to provide traders with a clearer understanding of the MACD crossover and to demonstrate how this technical signal can be applied effectively in Forex trading.
The MACD Crossover: What Is It?
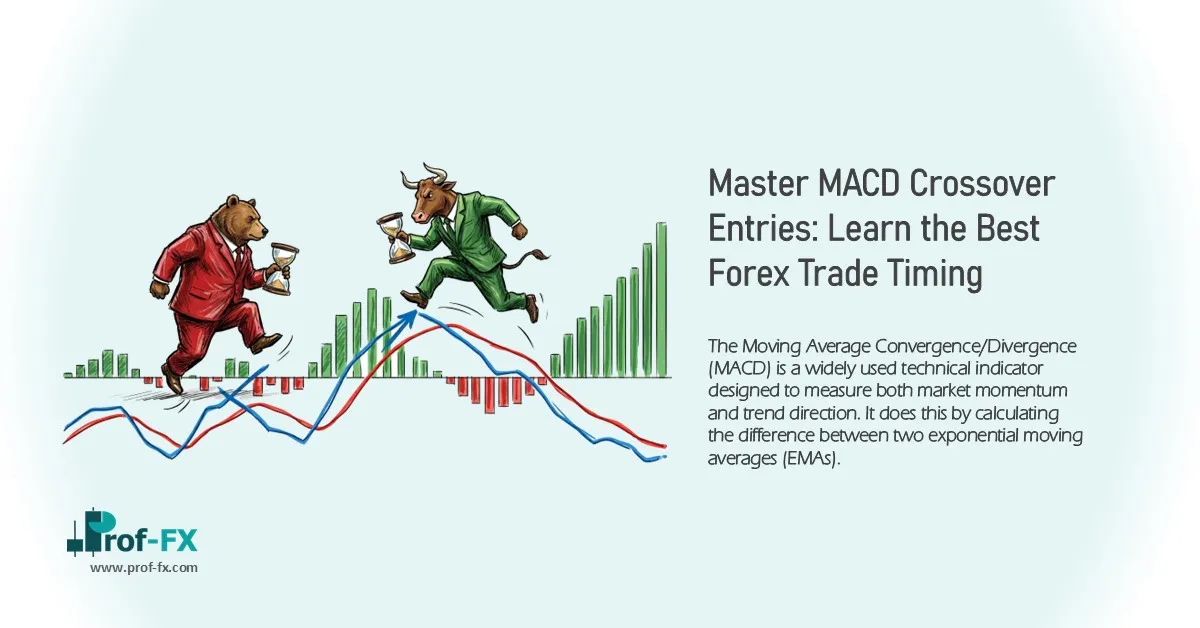
The Moving Average Convergence/Divergence (MACD) is a widely used technical indicator designed to measure both market momentum and trend direction. It does this by calculating the difference between two exponential moving averages (EMAs).
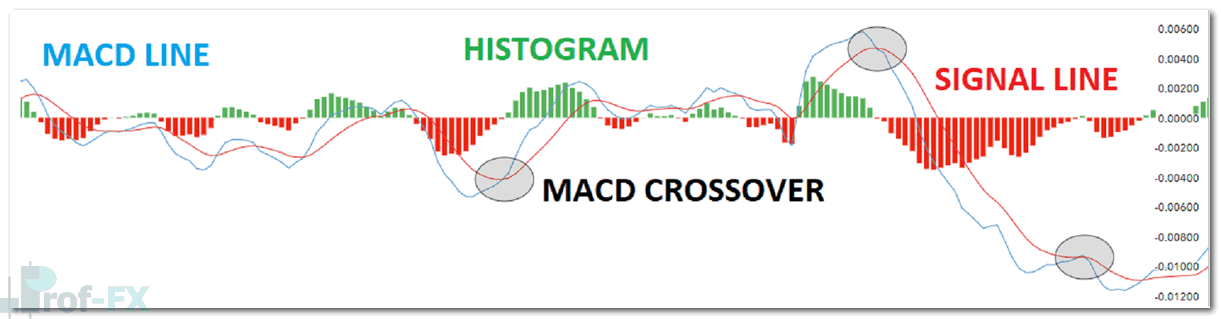
A MACD crossover occurs when the MACD line intersects with the signal line, which often suggests a shift in momentum and may indicate the beginning of a new trend or a trend reversal.
From a professional trading perspective, the MACD is considered one of the most reliable momentum indicators, particularly in clearly trending market conditions.
Components of the MACD
To use the MACD crossover effectively, it is essential to understand its core components:
The MACD line:
The MACD line (commonly shown as the blue line) represents the difference between two exponential moving averages, typically the 12-period EMA and the 26-period EMA. This is generally referred to as the faster line because it reacts more quickly to price movement.
Signal line:
The signal line is usually a 9-period exponentially smoothed moving average of the MACD line. This is often referred to as the slower line, as it reacts more gradually and helps generate crossover signals.
Zero line:
The MACD line fluctuates above and below a central zero line, giving the indicator oscillator-like characteristics that help traders assess bullish and bearish momentum.
Histogram:
The histogram consists of vertical bars that display the spread or distance between the MACD line and the signal line. This helps visualize whether momentum is increasing or weakening.
Using the MACD Crossover in a Forex Trade
Below are three highly effective ways to use the MACD crossover in Forex trading.
MACD crossover as an entry trigger
A strong entry strategy can significantly improve the probability of success by confirming trend direction before opening a position.
In the case of the MACD crossover, one of the most widely used entry signals occurs when the MACD line crosses the signal line in the direction of the prevailing trend.
A bullish signal is generated when the MACD line crosses ABOVE the signal line while both lines are still below the zero line. Once this crossover occurs, traders often wait for additional confirmation by allowing the MACD line to move above the zero line before entering a long position.
Likewise, a bearish signal is generated when the MACD line crosses BELOW the signal line while both lines are above the zero line. Confirmation becomes stronger when the MACD line subsequently crosses below the zero line, supporting a potential short position.
This confirmation-based approach is widely regarded as more reliable because it reduces the risk of entering on false signals.
Using divergence to determine momentum with crossover as confirmation
During periods of elevated volatility or strong directional movement, divergence can be extremely useful for evaluating the strength of a trend.
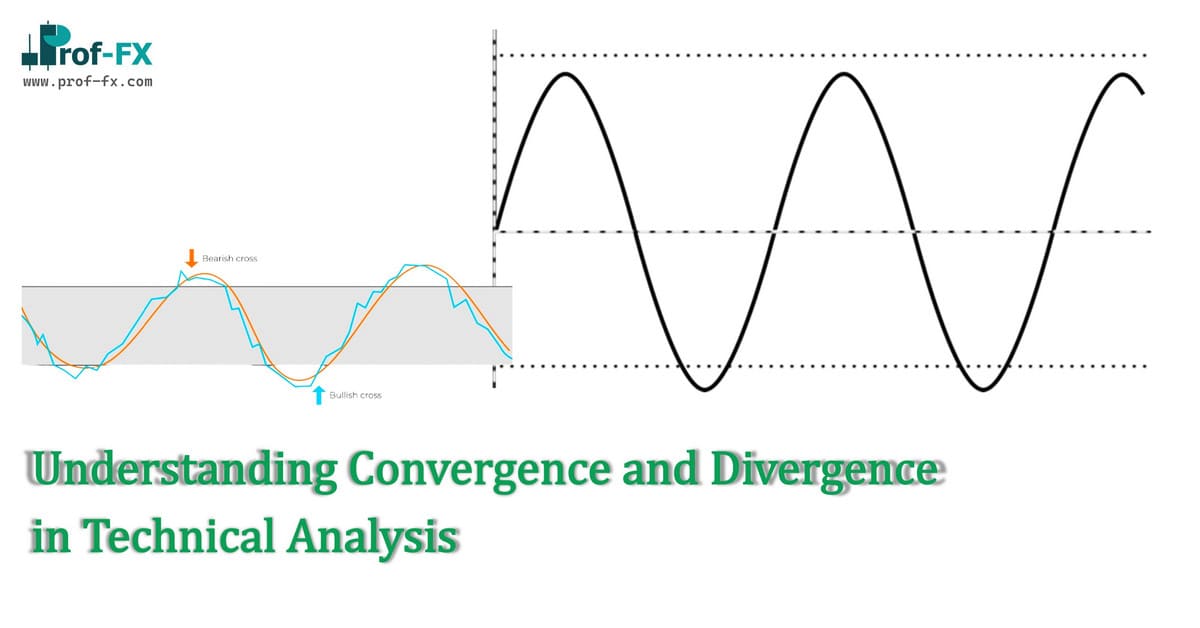
Divergence occurs when price action moves in a different direction from the indicator.
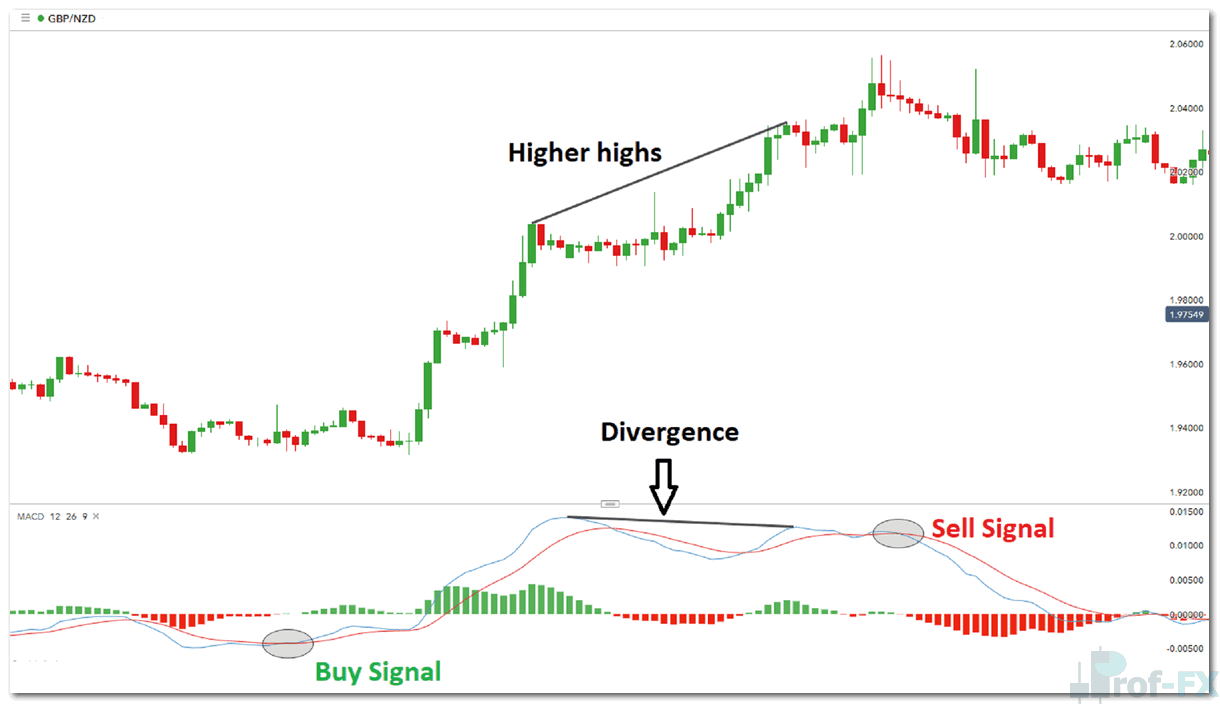
For example, on a GBP/NZD 2-hour chart, price may continue printing new higher highs, while the MACD simultaneously forms lower highs. This is known as bearish divergence and often indicates that the existing uptrend is losing momentum.
Divergence is frequently viewed as an early warning sign of a potential reversal or correction, because it suggests that momentum no longer fully supports price continuation.
When this setup appears, traders often wait for the next MACD crossover as confirmation before entering a trade in the opposite direction.
This combination of divergence plus crossover confirmation is considered a highly disciplined and technically sound approach.
Using the MACD crossover to filter signals in the direction of trend
For traders who follow the principle that “the trend is your friend,” the MACD crossover can serve as an effective filter for identifying signals that align with the broader market direction.
To identify an uptrend, traders typically look for a price structure consisting of higher highs and higher lows.
Another highly effective method is to observe the MACD line relative to the zero line:
- When the MACD line is above the zero line, the market is generally considered to be in an uptrend
- When the MACD line is below the zero line, the market is generally considered to be in a downtrend
Trend-following traders often use this as a directional filter and only look for buy setups when the MACD remains above zero.
Conversely, traders seeking sell opportunities generally focus on bearish crossovers when the MACD remains below the zero line.
This filtering method helps align entries with the dominant market trend and can materially improve trade quality.
MACD FAQs
Can you anticipate a MACD crossover?
Attempting to anticipate a MACD crossover or any technical signal before it actually forms is generally not recommended.
The MACD is classified as a lagging indicator, meaning it is derived from historical price action rather than predictive data.
Because of this, trading based purely on the expectation that a crossover might happen introduces unnecessary risk.
This is especially important in trending markets, where short-term volatility can cause temporary price spikes that invalidate anticipated setups.
A more professional approach is to wait for the crossover to be fully confirmed before executing the trade.
What is the best time frame to use for the MACD crossover?
The MACD crossover can be applied to any time frame, from intraday charts such as 5-minute or 15-minute, to swing trading charts such as 4-hour, daily, or weekly.
The most suitable time frame largely depends on your trading style:
- Scalpers and day traders often use shorter time frames
- Swing traders and position traders generally prefer higher time frames
From an expert trading perspective, using multiple time frame analysis is often the most effective approach.
A higher time frame can be used to identify the broader trend direction, while a lower time frame can help refine entry timing and increase signal frequency.
This top-down analysis method is widely used by professional Forex traders.
More Forex Trading Resources
Avoid one of the most common mistakes made by traders by reviewing our traits of successful traders guide.
Prof FX also provides Forex news, market insights, and technical analysis covering the key trends that influence the global currency markets.