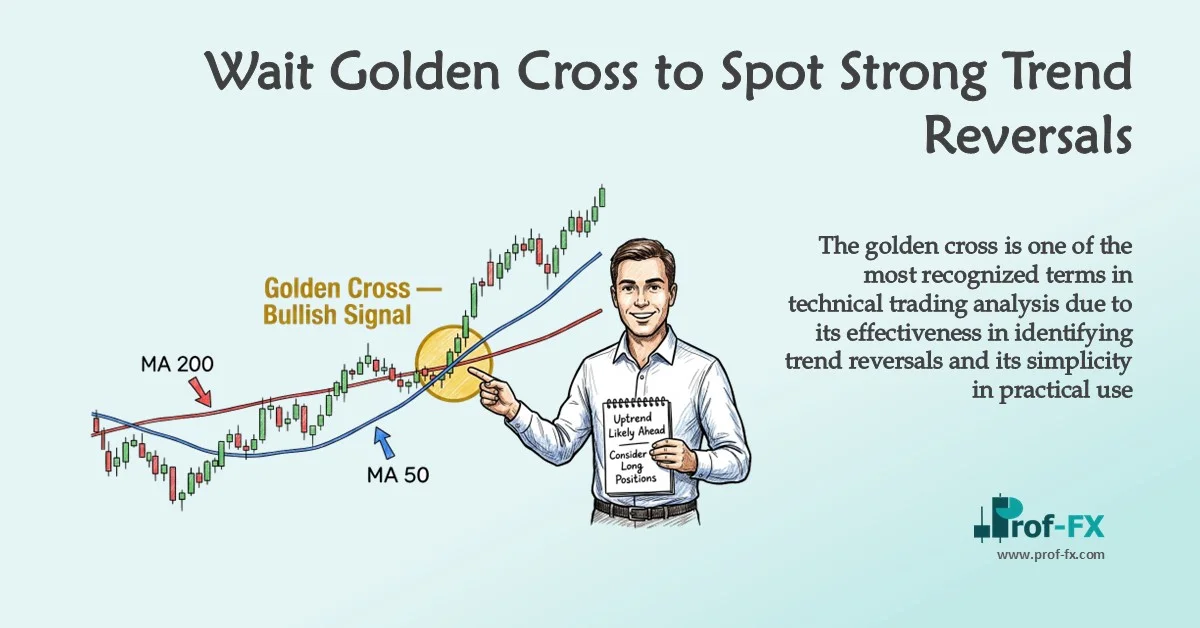
The golden cross is one of the most recognized terms in technical trading analysis due to its effectiveness in identifying trend reversals and its simplicity in practical use. It is widely followed by forex, stock, and index traders as a reliable way to detect when bearish conditions may be transitioning into a new bullish trend.
This article explains the concept of the golden cross, how to accurately identify it on a price chart, and which complementary indicators can be used alongside simple moving averages (SMA) to strengthen confirmation when analyzing changing market trends.
What Is a Golden Cross?
A golden cross occurs when the 50-period Simple Moving Average (SMA) crosses above the 200-period SMA.
This crossover creates a bullish market backdrop, indicating that short-term price momentum is strengthening and moving higher, with the potential to develop into a new long-term uptrend.
The technical logic behind this signal is straightforward and highly credible.
The 50 SMA is calculated as the arithmetic average of the closing prices over the most recent 50 periods—or 50 trading days when using a daily chart. Because it reflects a shorter period, it responds more quickly to recent price movements.
By comparison, the 200 SMA averages the last 200 closing prices, making it smoother and less sensitive to short-term market fluctuations.
As a result, when the 50 SMA crosses above the 200 SMA, it objectively confirms that recent bullish momentum has become strong enough to shift the broader trend structure into bullish territory.
This is why the golden cross is widely regarded as a high-confidence trend reversal signal.
For a deeper understanding of the calculation process, refer to our article: “Moving Average Explained for Traders.”
How to Identify a Golden Cross
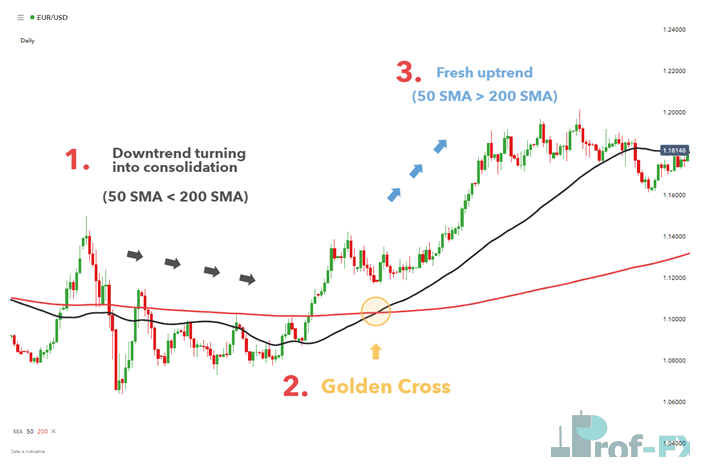
There are three main stages in the formation of a golden cross, and understanding each phase is essential for proper technical interpretation.
1. The Lead-Up Phase
The first stage begins when price action consolidates, or in some cases, moves sharply higher after an extended downtrend.
This phase often provides the earliest indication that bearish momentum is fading.
A consolidation period suggests that sellers are losing control and that the market may be preparing for a possible bullish reversal.
At this stage, the 50 SMA remains below the 200 SMA, meaning the golden cross has not yet formed, but early signs of a trend shift may already be visible.
This phase is particularly important for traders looking to anticipate the setup before confirmation occurs.
2. The Golden Cross Formation
This is the precise moment when the 50 SMA crosses above the 200 SMA.
At this point, the market officially forms the golden cross, establishing a clear bullish technical backdrop.
For many professional traders, this crossover acts as a trigger to begin looking for long entries, bullish continuation setups, or confirmation that a previous downtrend has likely ended.
The golden cross is not merely a visual crossover—it is a strong confirmation that short-term buying momentum is now overpowering the broader historical average.
3. Continued Upward Momentum
After the crossover is confirmed, the ideal next phase is continued bullish price action.
In many cases, price continues advancing higher, forming a fresh uptrend.
A particularly strong confirmation occurs when the 50 SMA starts acting as dynamic support, meaning that price repeatedly pulls back toward it and then resumes moving upward.
As long as price remains above the 50 SMA, the bullish structure generally remains intact.
This stage often presents the clearest trend-following opportunities for swing traders and position traders.
The Simple Moving Average as a Lagging Indicator
By its nature, the simple moving average is a lagging indicator, which means it relies entirely on historical price data.
Rather than forecasting future movement, the SMA helps traders interpret current market conditions by analyzing past price behavior.
Because of this, the golden cross signal naturally appears after part of the upward move has already taken place.
This delay is commonly referred to as indicator lag.
From an objective standpoint, this characteristic can be viewed in two ways.
Some traders may consider it a missed opportunity, as part of the move has already occurred before the signal is confirmed.
However, many experienced traders view this delay as beneficial because it provides greater conviction that the trend has genuinely changed, rather than simply reflecting a short-term retracement or temporary rebound.
This added confirmation is especially valuable in volatile forex markets where false reversals can occur frequently.
For short-term traders, such as scalpers and day traders, the traditional 50 and 200 SMA settings may react too slowly.
In these cases, traders often improve responsiveness by reducing the moving average periods.
For example:
- 10 SMA and 30 SMA
- 20 SMA and 50 SMA
This allows the same crossover logic to be applied to shorter-term market movements.
In addition, the Exponential Moving Average (EMA) can be used as an alternative.
Unlike the SMA, the EMA places greater weight on recent price action, making it more responsive to current market momentum.
For traders seeking faster confirmation, understanding the difference between SMA and EMA is essential.
Beyond this, several additional technical indicators can be used alongside SMAs to strengthen analysis during potential trend reversals.
Useful Indicators to Use with SMAs
For a trend to develop, the market typically needs to break out of an existing range or consolidation zone.
This breakout can be analyzed using pure price action—such as a break above resistance or below support—or through technical indicators.
Donchian Channel
The Donchian Channel is a highly effective indicator for identifying breakout conditions.
It plots the highest high and lowest low over a specified period, extending these levels forward on the chart.
This makes it easier to visualize key price boundaries that contain market movement.
A decisive break above or below the channel, especially when supported by strong momentum, may indicate the beginning of a long-term trend.
The chart below shows a break above the Donchian Channel with continued bullish momentum (red circle), suggesting that a new uptrend may be emerging.
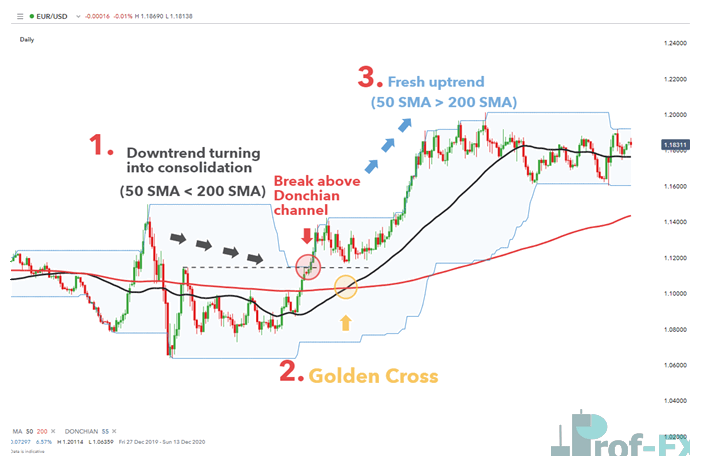
Since the golden cross is specifically designed to identify bullish trend reversals, it is logical to combine it with trend-following indicators after price breaks out of consolidation.
Moving Average Convergence Divergence (MACD)
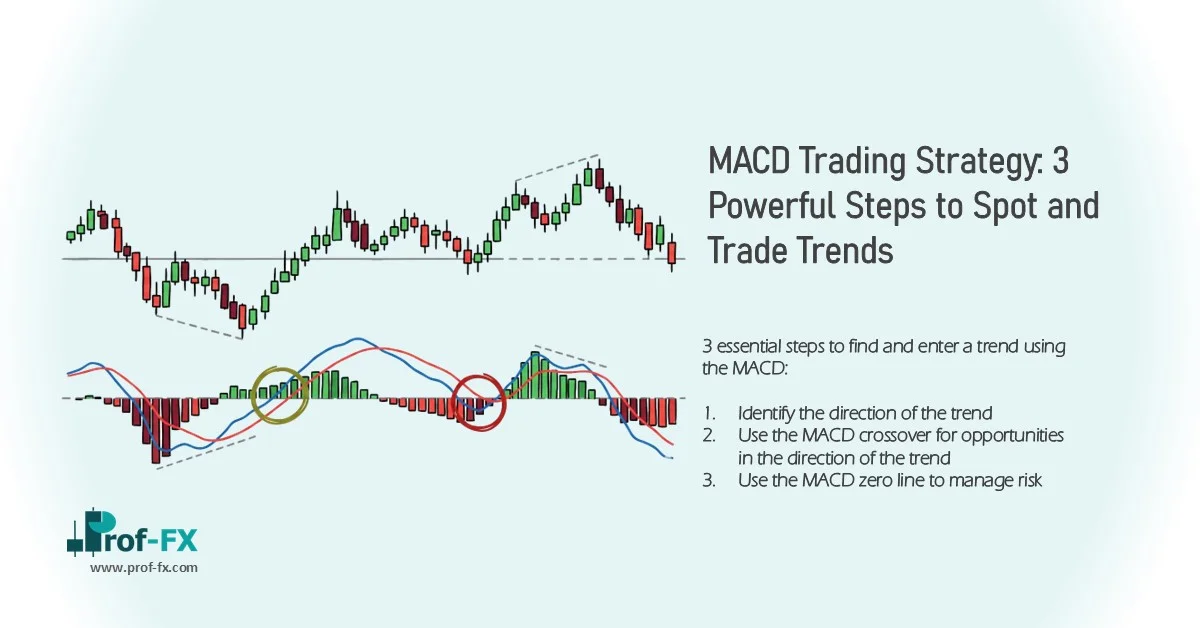
The MACD (Moving Average Convergence Divergence) is another powerful technical tool that averages price over time.
Its smoothing effect helps provide a clearer visual indication of market direction and momentum.
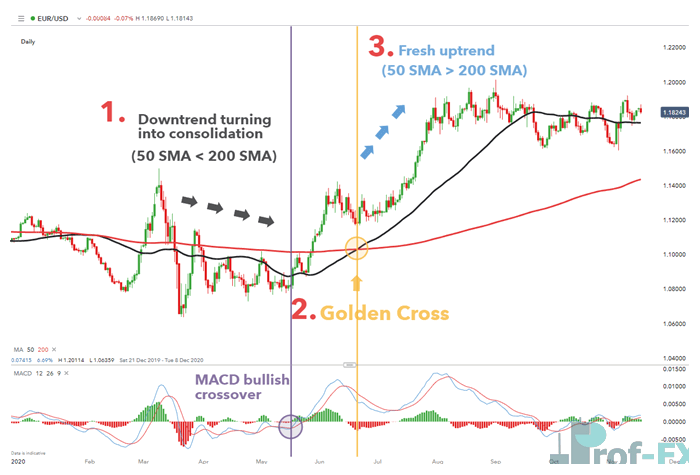
In the example below, the MACD actually provides the first indication of a potential uptrend, as seen in the bullish MACD crossover (purple circle).
This early signal establishes the initial bullish bias, which is later reinforced by the golden cross.
In this way, the golden cross serves as a secondary confirmation, adding greater authority and confidence to the bullish outlook.
This combination is widely used by experienced traders because it blends momentum confirmation with trend structure validation.
From a professional trading perspective, the golden cross remains one of the most respected and widely used bullish reversal signals, particularly when confirmed by breakout indicators, MACD momentum, and sustained price action above support levels.