


In price action analysis, one of the most revealing components of a candlestick is the wick. Earlier, we introduced support and resistance through this concept because it provides direct insight into how the market reacts at specific price levels.
A candlestick wick represents an intra-candle reversal. In practical terms, it shows that price moved in one direction but was rejected before the candle closed. When this rejection is significant forming a long wick, it reflects strong opposing pressure. This momentum often carries forward, influencing subsequent candles.
From an analytical perspective, the most critical level is where the wick begins. This marks the point at which the reversal originated, often visible on lower time frames. As such, it becomes a relevant support or resistance level that traders can monitor for future setups.
When Multiple Wicks Align at the Same Level
The analytical value increases substantially when multiple wicks form around the same price. This alignment is not random, it indicates repeated rejection at a specific level, confirming its importance in market structure.
Consider the following USD/JPY example:
USD/JPY Hourly Price Chart
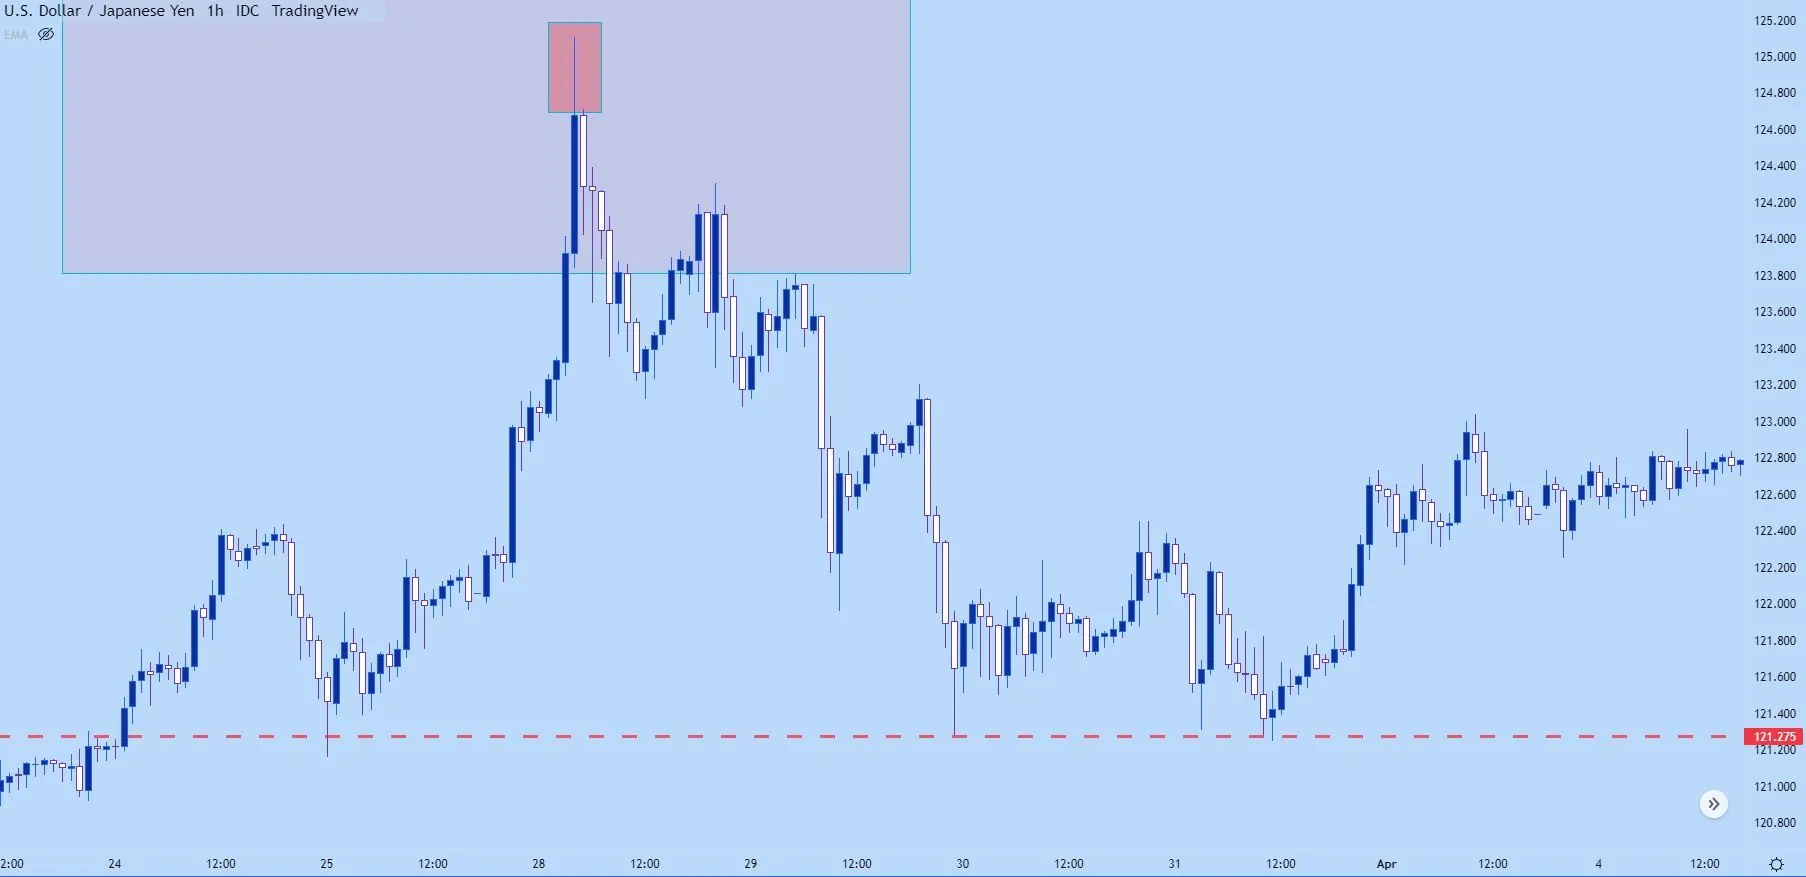
Initially, attention is placed on a reversal signaled by an extended wick. However, after the move develops, price revisits the same level marked by the red line. On the first retest, the sell-off halts. On the second attempt, price again fails to break lower.
This repeated reaction demonstrates that buyers are actively defending the level, establishing it as a zone of support.
Confirming Support Through Repeated Reactions
To further illustrate this behavior, observe the highlighted zones below:
USD/JPY Hourly Price Chart
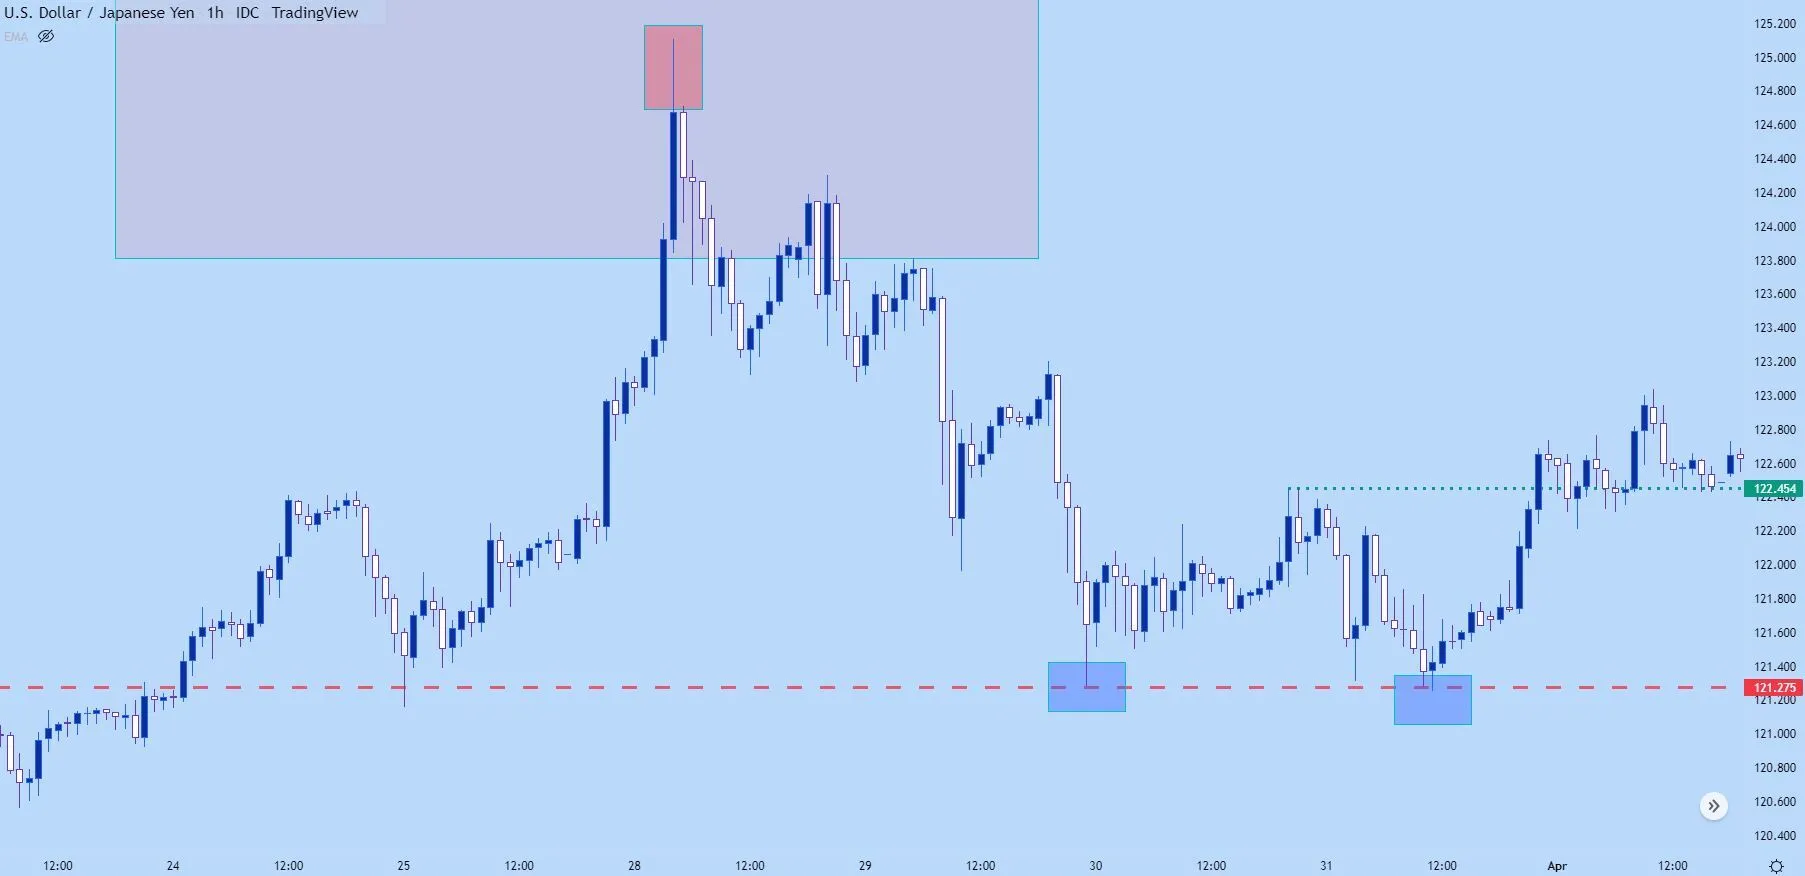
Each bounce from the same level reinforces the validity of that support zone. When two distinct reactions occur at the same price, it often signals the formation of a double bottom pattern.
This pattern reflects a key market principle: when price fails to break below a support level multiple times, buying pressure may eventually dominate, leading to a bullish reversal.
The Role of the Neckline and Breakout Confirmation
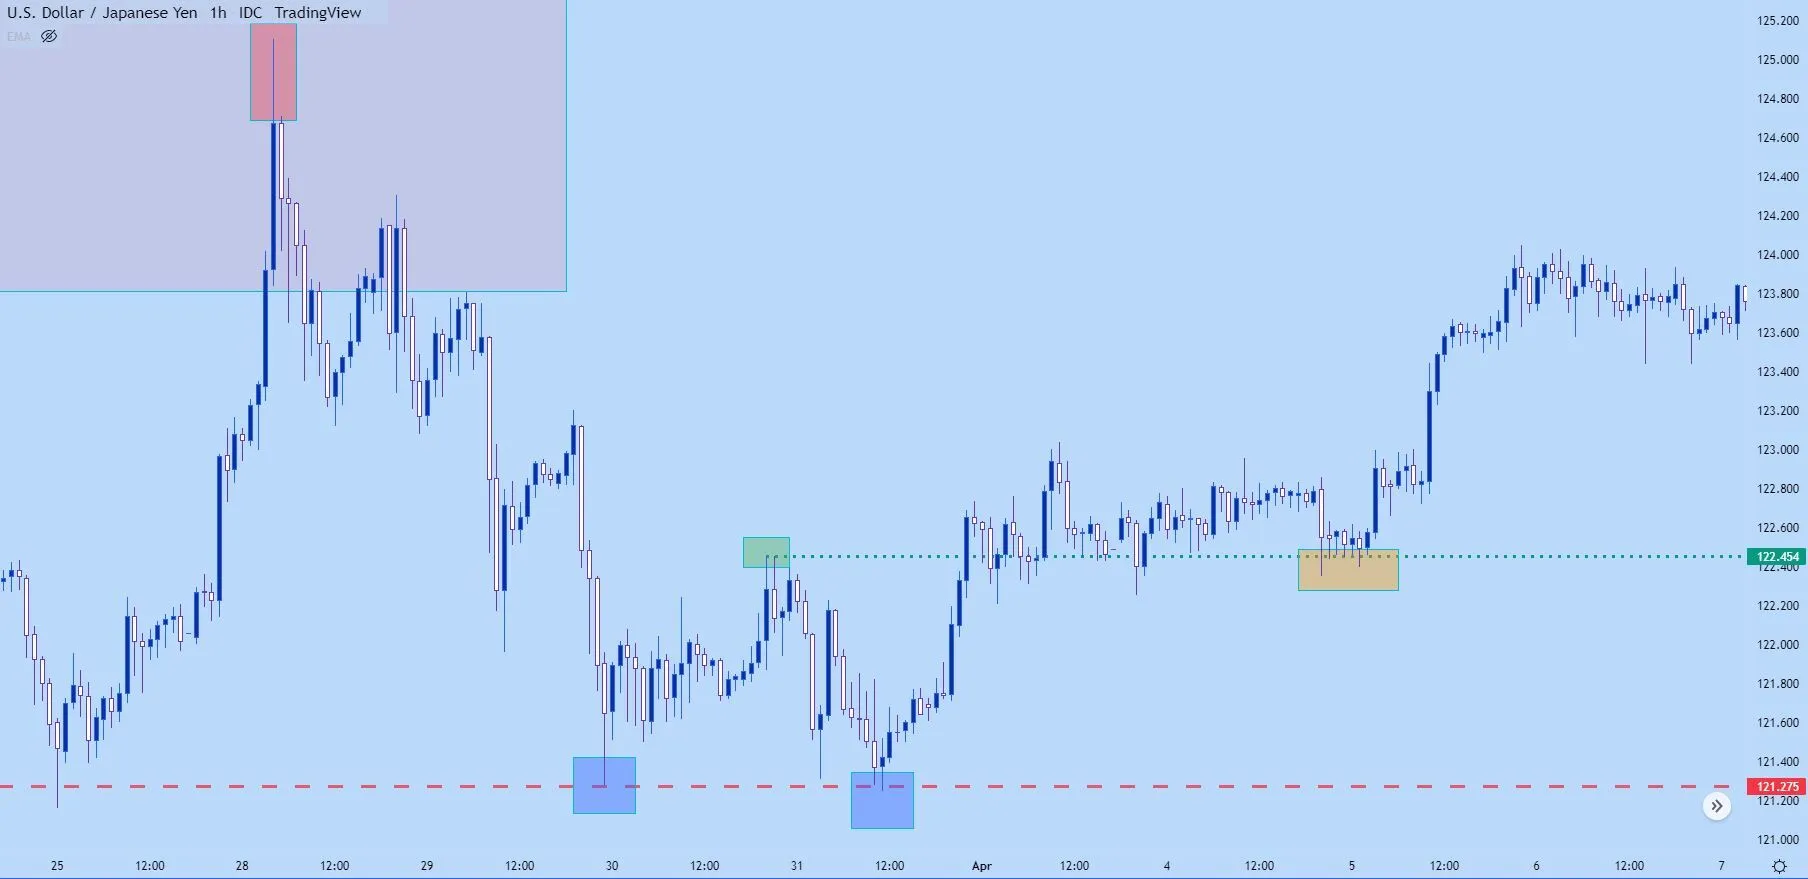
Between the two support reactions, a local high forms commonly referred to as the “neckline.” This level represents interim resistance within the structure.
A confirmed breakout above the neckline is a critical development. It signals that buyers have gained control, initiating a potential bullish trend.
In the example below, price breaks above the neckline shortly after the second support test. Notably, the former resistance (neckline) is then re-tested and holds as support, demonstrating a classic support-resistance role reversal before price continues higher.
USD/JPY Hourly Price Chart
Wick Sequencing Across Timeframes
To deepen the analysis, the same price action can be viewed on a higher timeframe, such as the four-hour chart:
USD/JPY Four-Hour Price Chart
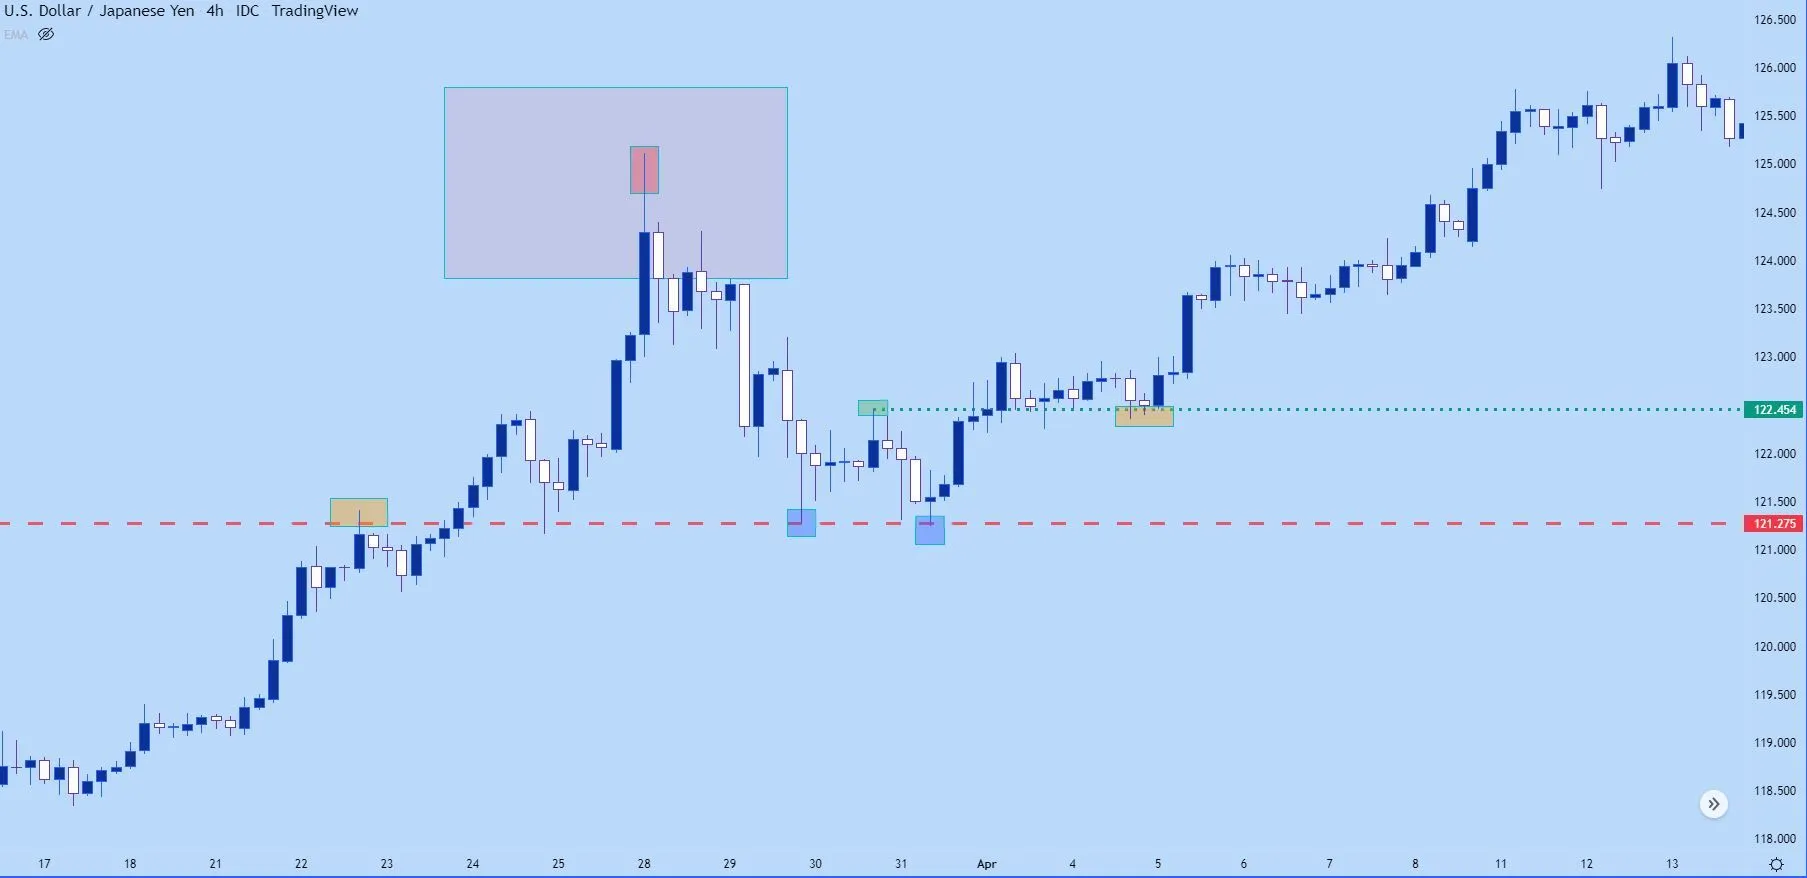
Higher timeframes aggregate more data into each candle, reducing noise while maintaining the integrity of key price levels. Although this reduces granularity, the core principle remains unchanged: price levels that act as support or resistance will leave visible traces through wicks.
When multiple candles display wicks concentrated around a specific area, this is known as wick clustering or sequencing. This phenomenon highlights a strong and active price level influencing market behavior.
In the chart above:
- The first highlighted zone (left orange box) shows resistance that later transitions into support.
- The second zone (right orange box) reflects support that was previously resistance.
These levels are not arbitrary, they are rooted in prior market activity. Historical price interaction reinforces their validity, making them reliable reference points for future trading decisions.
Key Takeaway
Candlestick wicks are not merely visual artifacts; they are direct evidence of market rejection and order flow. When analyzed correctly, especially in clusters or repeated formations, they provide a precise method for identifying high-probability support and resistance zones.
From a professional standpoint, traders should treat wick-based levels as structurally significant. Consistent rejection at the same price is a clear signal of market intent, and integrating this insight into trading strategies enhances both timing and accuracy in execution.


 in Forex Trading")
