


Candlestick wicks play a central role in price action analysis because they reveal how the market reacts at specific price levels. These reactions are not random; they reflect underlying shifts in supply and demand, which can influence future price movement.
In trading, outcomes are always probabilistic. When a strong reaction occurs especially one that rejects price aggressively, there is a measurable likelihood that this behavior may persist or reappear. This is the foundation for using wicks as analytical tools.
However, not all wicks carry equal significance. Among them, pin bars stand out as one of the most informative and actionable formations for identifying potential reversals.
What Is a Pin Bar?
A pin bar is a candlestick characterized by:
- A long wick (shadow) on one side
- A small body positioned near the opposite end of the candle
This structure reflects a sharp rejection of price within a single trading period.
For example, consider a bearish pin bar:
- Price initially moves higher, continuing the prevailing trend
- Buyers push price to a new high
- Strong selling pressure emerges
- Price reverses and closes near the low of the candle
This creates a long upper wick, signaling that higher prices were rejected.
GBP/USD Daily Chart
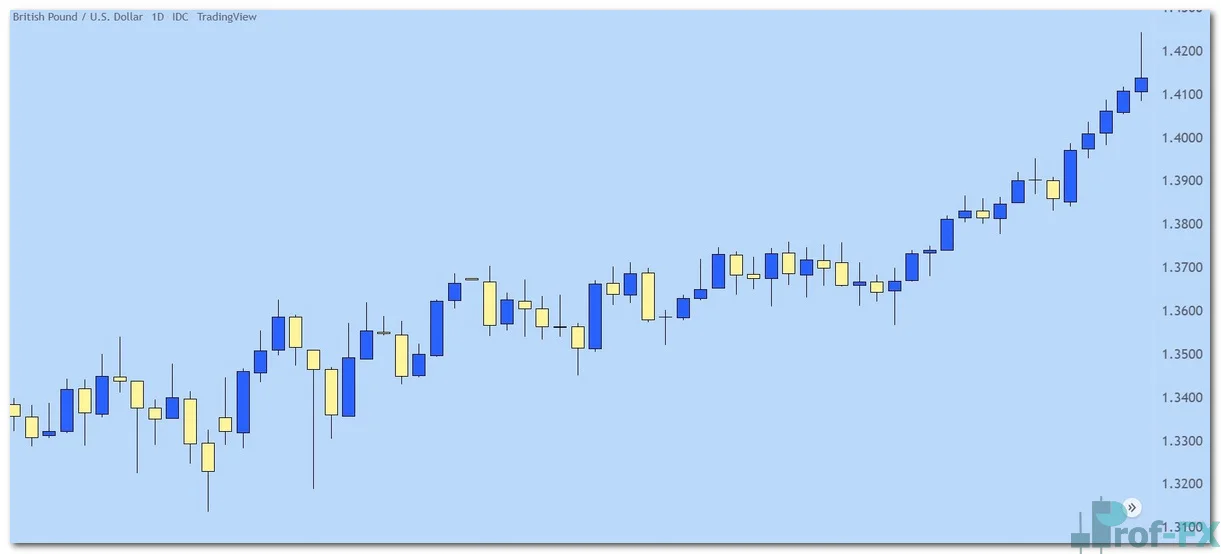
In the chart above, the final candle shows a pronounced upper wick with a small body near the lower portion. This indicates that bullish momentum initially dominated, but was quickly overwhelmed by sellers.
The term “pin bar” is derived from “Pinocchio,” symbolizing a false move. Just as Pinocchio’s nose grows when he lies, the extended wick represents a move that the market could not sustain, effectively a “false” breakout or exaggerated price movement.
Why Pin Bars Matter
The defining feature of a pin bar is its rejection of price. This rejection often occurs at key levels such as:
- Support and resistance
- Psychological price zones
- Prior swing highs or lows
The fact that the wick “sticks out” from surrounding price action is critical. It indicates that price attempted to move beyond a level but failed, suggesting the presence of strong opposing orders.
From a structural perspective, this signals:
- Potential exhaustion of the current move
- Entry of institutional or large-volume participants
- Increased probability of a reversal or pullback
Market Reaction After a Pin Bar
To understand the effectiveness of pin bars, it is essential to observe what happens after they form.
GBP/USD Daily Price Chart
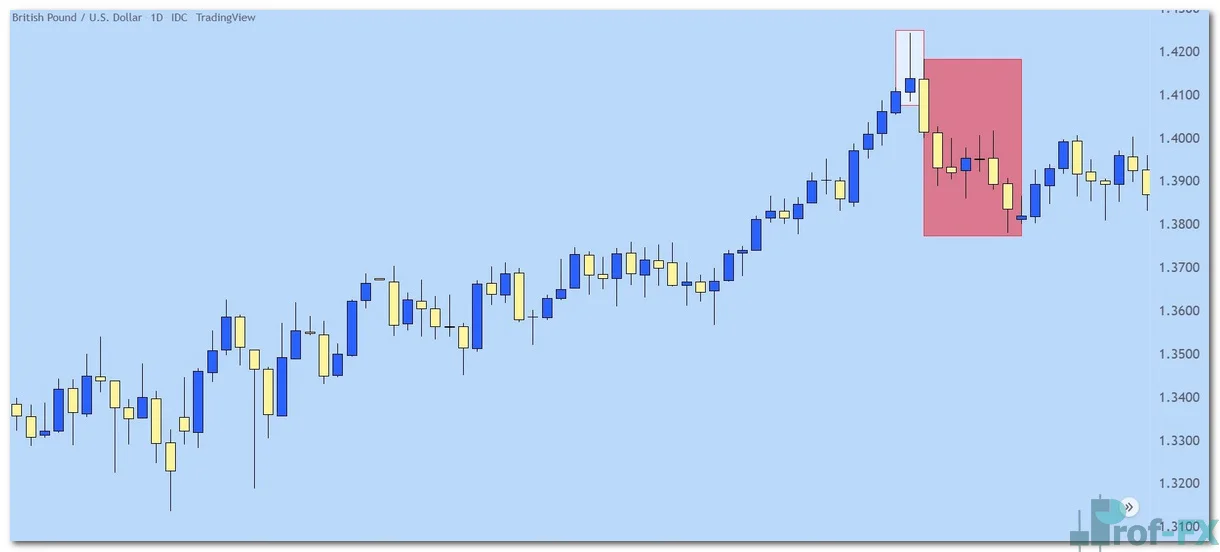
In this example, the bearish pin bar marked the beginning of a sustained downward move. The initial rejection was not an isolated event it represented the start of continued selling pressure over the following weeks.
This confirms a key principle: pin bars are early signals, not confirmations. They highlight the potential for change, which must then be validated by subsequent price action.
Pin Bars as Long-Term Reference Levels
An additional layer of importance emerges when the same price level is revisited.
GBP/USD Daily Price Chart
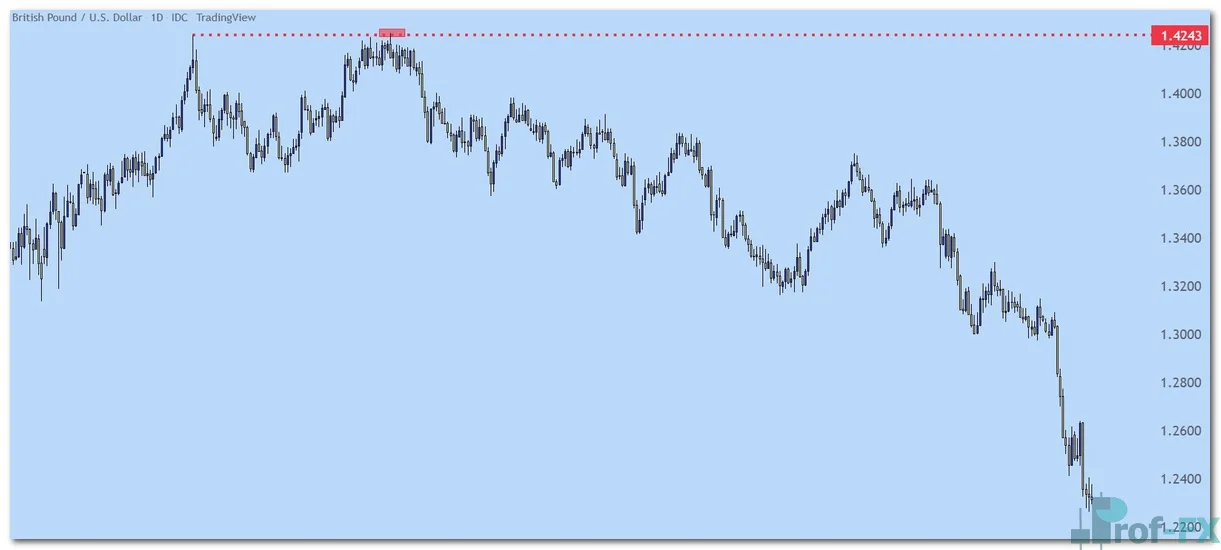
In the chart above, the level that triggered the initial pin bar later acted as resistance again. This demonstrates how the rejection that formed the pin bar established a meaningful price level in the market.
The logic is straightforward:
- The initial rejection was caused by strong selling interest
- That interest may persist over time
- Future tests of the same level can produce similar reactions
This reinforces the role of pin bars not only as reversal signals but also as markers of key support and resistance zones.
Key Takeaway
Pin bars are powerful price action signals because they capture sharp and decisive market rejection within a single candle. Their effectiveness lies in both their structure and their context.
From a professional standpoint:
- A pin bar reflects a failed price move and a shift in control
- Its wick identifies a critical level where supply or demand is dominant
- Its reliability increases when aligned with key market structure
Traders who incorporate pin bars into their analysis gain a clearer view of market sentiment and potential turning points, allowing for more precise and disciplined trading decisions.


