


Price action forms the core of technical analysis and represents a direct, highly effective method for identifying trading opportunities. It focuses on three essential components: trend, support and resistance, and market reaction. When these elements are analyzed together, they provide a structured and reliable framework for making trading decisions.
Highlights:
- Price action analysis offers a clear and practical approach to identifying trading opportunities
- Key elements include trend identification, support & resistance levels, and reaction signals for confirmation
- Integrating these components leads to more precise and disciplined trading decisions
Technical analysis consists of various methodologies, but price action remains its fundamental layer. By evaluating how price behaves over time, traders can interpret market intent without relying heavily on lagging indicators. The three pillars is trend, price levels, and market reaction, serve as actionable tools for understanding market dynamics.
Trend
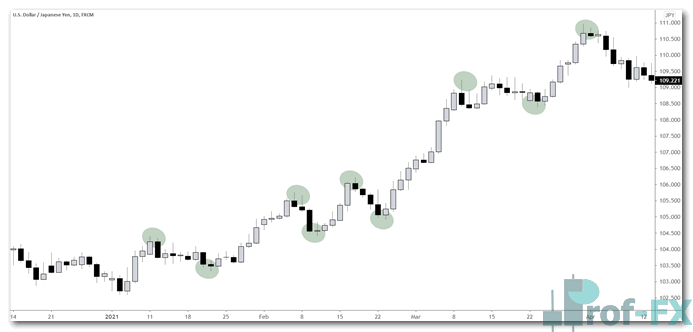
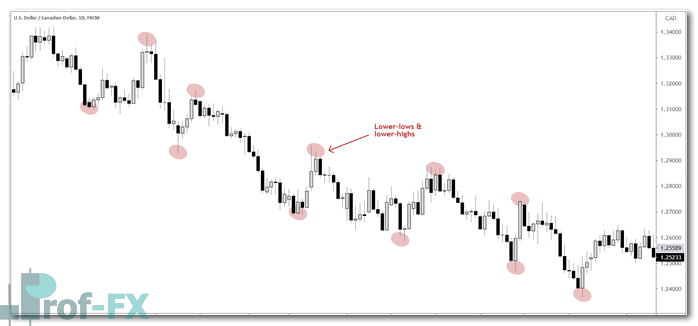
A trend defines the general direction of the market and is most accurately determined by observing price structure. An uptrend is characterized by higher highs and higher lows, while a downtrend consists of lower lows and lower highs. When neither condition is present, the market is considered to be in a range.
Although indicators can assist in identifying trends, price structure itself provides the most objective and reliable confirmation.
Trends exist across all timeframes. However, the widely accepted principle is that higher timeframes carry greater significance than lower timeframes. For example, combining the daily chart with the 4-hour chart in forex trading offers a balanced and comprehensive market view.
It is common for conflicting trends to appear across timeframes. A short-term uptrend on the 4-hour chart may occur within a broader downtrend on the daily chart. In such cases, the higher timeframe trend should be prioritized, as it reflects the dominant market direction. Short-term movements are often temporary corrections that eventually align with the larger trend.
Example of an Uptrend
Example of a Downtrend
Support and Resistance
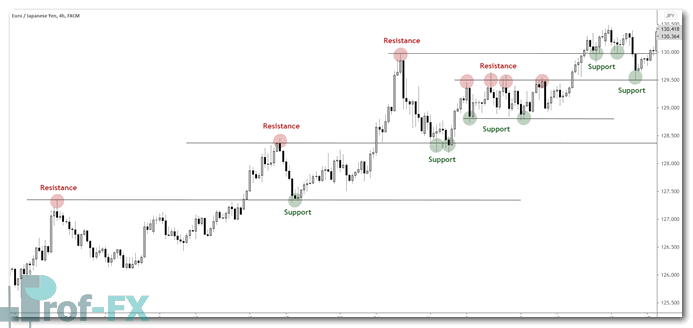
Support and resistance levels are critical price zones where market participants consistently react. Support represents a level where buying interest (demand) prevents price from falling further, while resistance marks an area where selling pressure (supply) limits upward movement.
These levels can be identified using various tools such as Fibonacci retracement or moving averages. However, the most reliable approach in price action trading emphasizes:
- Historical price levels
- Trend lines
- Market structure and slope
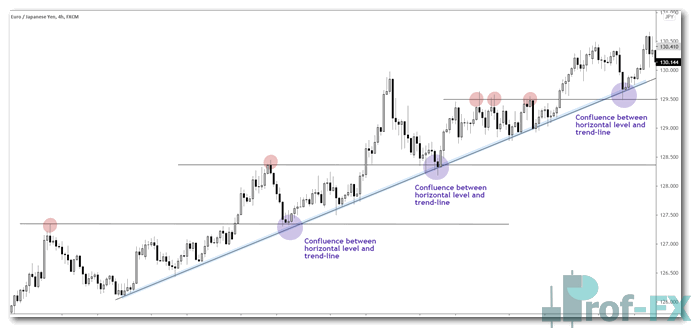
A key concept in this context is confluence. When multiple forms of support or resistance align, such as a horizontal level intersecting with a trend line, the level becomes significantly stronger and more reliable. This convergence increases the probability of a meaningful market reaction.
Example of Support and Resistance
Example of Confluence
Market Reaction (Validation and Invalidation)
The final and decisive component of price action trading is market reaction. This step evaluates how price behaves when it reaches key levels within the context of the prevailing trend. It determines whether the observed setup is valid or invalid.
At this stage, trading decisions are formed based on confirmation signals. One of the most effective tools for assessing market reaction is candlestick analysis. Specific candlestick patterns provide clear evidence of rejection or momentum shifts, including:
- Reversal candles such as pin bars, shooting stars, and bullish hammers
- Strong continuation or reversal signals like engulfing bars
These patterns indicate a rejection of price at support or resistance, signaling that market participants are actively defending those levels.
Once a reaction is confirmed, traders can define risk and reward parameters with precision:
- Stop loss placement should be set beyond the relevant support or resistance level to avoid premature exits due to minor price fluctuations
- Take profit targets should be based on logical price structures and aligned with a favorable risk/reward ratio, ideally at least 1:2 or better
This disciplined approach ensures that trading decisions are grounded in analysis rather than arbitrary expectations.
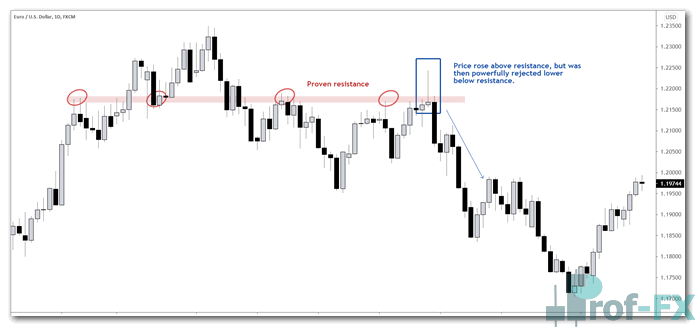
Example of Powerful Reversal Around Resistance
Conclusion
Price action trading provides a structured and evidence-based approach to market analysis. By systematically evaluating trend, support and resistance, and market reaction, traders can identify high-probability setups with clarity and confidence.
This methodology is not only foundational but essential. It eliminates unnecessary complexity and focuses on what matters most, price itself. As a result, traders who master price action are better equipped to make consistent, objective, and well-informed trading decisions in the forex market.


